
The Effects of Train Passes on Dwell Time Delays in Sweden


1
Department of Technology and Society, Lund University, 22100 Lund, Sweden
2
K2 Swedish Knowledge Centre for Public Transport, Bruksgatan 8, 22236 Lund, Sweden
3
Department of Mechanical and Industrial Engineering, Norwegian University of Science and Technology, Richard Birkelands vei 2B, 7491 Trondheim, Norway
*
Author to whom correspondence should be addressed.
Appl. Sci. 2022, 12(6), 2775; https://doi.org/10.3390/app12062775
Submission received: 10 January 2022
/
Revised: 4 March 2022
/
Accepted: 6 March 2022
/
Published: 8 March 2022
(This article belongs to the Special Issue Application of Intelligent Transportation Systems in Railway)
Abstract
:Railway traffic is growing, resulting in a highly interconnected train network. Due to the interdependence between trains’ activities, a better understanding of train passes and their effects can ensure dispatching decisions made have minimum risk of delays. The impacts of train pass on dwell time delays were investigated using historical Swedish railway operation data. Three scenarios were considered by combining the scheduled and actual operations: passes that happened as scheduled, unscheduled passes that happened in operation, and scheduled passes that were cancelled. A logistic regression model was used to explore the effects of these passes on delays. The findings show that train passes rarely occurred as scheduled, more frequently they are cancelled or unscheduled. This implies that some adjustments are required to assure the timetable’s feasibility. This study also found that the odds of delays for the cancelled pass was about 9.80 times lower than scheduled pass but 2.6 times more often for an unscheduled pass than a scheduled pass. The different types of train passes were quantified using an odds ratio to make comparisons easier for dispatching decision-making. The approach used in this study can be extended to other types of train movements, such as the meeting of trains, as well as other delay-influencing factors.
1. Introduction
Traffic on the railways has been increasing steadily in recent years. The complexity of railway traffic in Sweden has grown as a result of high utilisation combined with highly heterogeneous traffic. According to [1], the number of passenger trains increased by 19% from 852,000 to 1,016,000 between 2013 and 2018. Busy networks of railway traffic are constantly subjected to random disturbances. To mitigate the impacts of these disturbances, effective real-time dispatching measures are needed to reschedule train services into new conflict-free train path plans. However, dispatching actions can result in new train conflicts and the propagation of delays.
1.1. Dwell Time Delays
Dwell time is important in ensuring the system performance, service reliability, and quality in public transport, and it is often where delays first occur [2]. Train dwell time can be defined as the time a train stops at the platform, often for the purpose to allow passengers to board or alight. In [3], it was mentioned that a delayed train can use its dwell time margin to recover time. Realistic dwell time allocation reduces the risk of a train exceeding its track occupation time, thereby preventing deviations from the scheduled train path. In [4], the authors statistically analysed train operations between two Dutch major railway stations in the Hague. They indicated that when scheduled dwell or run times are exceeded due to hindrance by other trains, then the headway between arrival and departure of some pairs of trains at critical route nodes will be insufficient, causing route conflicts. Delays can propagate as secondary delays to other trains, and consequently, disturb the entire network, as identified by [5]. On the other hand, in [6] found that a train will not hinder other trains as long as it remains within its allocated train path envelope, as indicated by a high percentile of realised process time (for running, dwelling, and turning processes) and a sufficient buffer time in addition to the minimum headway time between train paths.
1.2. Delay Management
Delays can be avoided through effective timetabling and dispatching decisions of traffic controllers. In [6], the authors defined timetable resilience as the flexibility of a timetable to prevent or reduce secondary delays using dispatching actions. Management of unexpected delays depends on the ability of the train dispatchers to make accurate decisions in advance by taking into consideration the inter-dependency between trains. However, dispatching measures are often sub-optimal as train dispatchers have a limited view of the effects of conflict resolution methods and are unable to compare alternative solutions based on various performance indicators due to the limited time available for real-time decision-making [7]. In [8], the authors also found that the dispatching algorithms are less efficient if only one station ahead instead of two is considered when calculating the best dispatching solution.
Extensive efforts have been made to develop decision support tools to monitor delays in the rail network to effectively reschedule trains during operations. In [9], the authors proposed a dispatching optimisation method based on a greedy algorithm to obtain an optimal relationship between capacity and operational quality. To optimise train schedules on single line rail corridors, in [10], the authors devised a mathematical programming model that prioritises trains in conflict based on remaining crossing delays, overtaking delays, and current delays. To generate a periodic network-optimal timetable, [11] optimised the train order, run and dwell times, and overtaking locations of a line plan, and then evaluated the timetable’s stability. In [12], a delay root cause discovery model that used machine learning to anticipate the delay root cause by analysing scheduled and unscheduled train meetings, overtaking behaviours, and the consequent delay propagation was proposed.
Different dispatching strategies, such as re-timing [13,14], reordering [15], rerouting, and even train cancellations [16,17], have been used to solve the train rescheduling problem, that is, to minimise deviation from original timetables. However, research into the effects of train passes on delays is relatively scarce. In [18], it was found that congestion-related factors such as meets and passes have the largest effect on congestion delays. In [19], the impacts of train meets and passes to dwell time delays through a novel measure of the excess probability of delays was captured. The study found that meets and passes of the train are not evenly distributed geographically in Sweden and tend to increase the risk of delays by around 30%.
1.3. This Study
To improve the real-time decision-making abilities of train dispatchers, it is useful to first study the effects of their decisions. Dispatching decisions are closely related to the interaction between trains, which can influence the train speed profiles and the orders of trains at conflict points, leading to complex problems if inaccurate decisions are made.
Thus, this study focused on the different types of passes for passenger trains and explored their effects on dwell time delays. This is the most common type of delay for passenger trains in Sweden. The contributions of this article include:
- 1
- Based on the historical train operation data, an overview of different types of passes in Sweden is provided, and their impacts to dwell time delays in terms of probability is assessed. With a better understanding of train passes and their effects on delays, timetabling and dispatching measures can be targeted to increase trains’ ability to pass each other without incurring delays, resulting in more punctual railway operations.
- 2
- The use of the odds ratio is proposed to aid dispatchers in making dispatching decisions based on the odds of delays due to various dispatching actions. This is a simple metric that provides clear and direct information on which the dispatching approach has the best odds of not causing delays, allowing for a comparison between the efficiency of two different actions. It can be used to assess any dispatching choice, however, in this study it was utilised to compare different types of train passes. Previous research tends to employ regression models to predict the magnitude of the delays, but few have compared the effectiveness of alternative train passes in reducing the occurrence of delays.
This article is organised as follows: In Section 2, the mathematical formulations and methodology used in this study are introduced. In Section 3, we analyse and discuss the results generated and measure the effects of train passes. Finally, Section 4 concludes and includes recommendations for further research.
2. Train Passes and Delays
In this study, we focus on the different types of train passes on double-track lines, where they are much more common than on single-track lines. A train pass occurs when a train passes another train moving in the same direction. Two assumptions are made in this study: (1) double tracks are treated as a separate independent system in each direction, and (2) the separate systems are reserved for trains in one direction each. This implies that each track in the double track is subjected to one-way traffic, and the trains are assumed to not encounter oncoming trains or turns through oncoming trains since the trains can only move in one direction. Thus, train conflicts in the opposite directions as well as in switching areas were not taken into consideration in this study. These assumptions are illustrated in Figure 1.
Comparing the timetable to actual operation, there are three possible outcomes with regard to the train passes. For instance, passes can be scheduled (1), cancelled (2), or unscheduled (3). This study does not consider the most common situation (4) when there is no pass in the timetable or in actual operations. Table 1 illustrates these different possibilities.
Figure 2 shows a scenario where train A is scheduled to enter the line after train B. At stations A and D, there is no pass, as the trains do not overlap. At station B, there is a cancelled pass, because train A is scheduled to pass train B but does not do so. At station C, there is instead an unscheduled pass, where no pass is scheduled but one took place.
2.1. Data Studied
In this study, we used train operation data from the Swedish Transport Administration, which covers all train movements on double tracks in Sweden for the year 2014. Observations for Saturday and Sunday were omitted because there were differences in travel behaviour between weekends and weekdays. There were also fewer trains on weekends, reducing the risk of delays. As reported by [20], punctuality was measured to be 94–95% for Saturday and Sunday, respectively, but on weekdays, punctuality was in the range of between 90–91%.
Finally, the number of observations of train movements were reduced from 13,000,000 to 403,000 when all the trains with no scheduled or actual pass are filtered out. Even though no pass constituted approximately 97% of the data, they were excluded from the analysis because the inclusion of trains with no pass into the model reduces the representativeness of the model, causing large Akaike’s Information Criteria (AIC) [21] and Bayesian Information Criteria (BIC) [22] and low . Both AIC and BIC assess the overall fit by estimating the relative amount of information lost in a model. The lower the AIC and BIC values, the lower the model’s prediction error. denotes the proportion of variation in the dependent variable that can be predicted by the independent variable(s). In contrast to AIC and BIC, the higher the , the better the model.
Instead, we focused on the 3% of the train movements with scheduled and/or actual passes. This data set was split into common split percentages, that is 80% training and 20% test data set. The 80% of training data was used for model training, while the remaining 20% was used for checking how well the model generalised on the unseen data set.
2.2. Combined Dwell Delays
In [22,23], the authors demonstrated that delays arise especially at stations since the crossing or merging of lines and platform tracks are in most cases the bottleneck in highly used railway networks. Since delays are more common at stations, this study was focused on dwell time delays instead of run- or arrival-time delays. A dwell time is the time that a train stops at a station. It is the difference between the arrival and departure times.
If is dwell time, is departure time, and is arrival time, then
A dwell time delay is the difference between the realised dwell time and the scheduled dwell time.
where represents dwell time delay; represents realised dwell time delay; represents scheduled dwell time delay; represents realised departure time; represents realised arrival time; represents scheduled departure time; represents scheduled arrival time. The focus of this article is on dwell time delays, measured in terms of combined dwell delays for both trains:
where represents combined dwell delays of train A and B at the same station; represents dwell time delay of train A; represents dwell time delay of train B. This study does not take into account prioritisation issues among trains, and a delay is said to occur when there is a net delay across both trains, without giving more weight to either train A or B (see [19] on the calculation of combined dwell delays). The combined dwell delays used in this study were recorded in terms of minutes. Since the data used in this study are in hours and minutes, we can only calculate a minimum delay of at least one minute. Thus, if a combined dwell delay is greater than 0 min, a dwell time delay is considered to have occurred.
3. Modelling with Odds Ratios and Logistic Regression
In this study, probability and odds ratios were used to investigate the tendency of combined dwell delays that occurred due to different types of train passes. Probability is the proportion of the number of instances that meet the criterion, divided by the total number of instances. Since the probability is in the range between 0 and 1, it was interpreted in terms of percentage in this study.
where represent the probability of the event i occurring
Odds are a way of using probability to estimate the chance that an event occurs divided by the probability that the event does not occur.
In this study, the odds ratio was used as a comparison between two events. Specifically, we compared the odds of delays for cancelled or unscheduled passes with the odds of delays due to passes that are carried out as scheduled:
It is also important to note that odds and odds ratio do not have units, just like percent.
The logistic regression model is a statistical modelling technique that estimates the probability of a dichotomous outcome event being related to a set of explanatory variables. By convention, the dependent variable is designated as being positive when delays increase and negative when not with the scores of 1 versus 0, respectively, for coding of the dependent variable in computerised data sets. The logistic regression model can also be written as
Notice that the left-hand side of the equation is the log odds of a delay occurring.
Logistic Regression Model
The model in this study is a logistic regression model that is created to contain the main effects of different types of train passes and with the occurrence of dwell time delays as the response. There is always a trade-off between the prediction performance and the underlying causal inference that must be taken into consideration when selecting a suitable model for the topic of study [24]. In this case, we opted for a simple statistical model, which can provide a better understanding of the relationship between parameters, instead of a more complex model. Other types of models might provide better predictive power but be more difficult to interpret.
If are dummy variables representing cancelled and unscheduled passes, respectively, the model has the form:
In this model, the independent variable in this study was the type of pass, a categorical variable with three categories. Thus, two dummy variables were created, with trains in the category for scheduled pass as the reference group. This reference group was coded as zero in the data set, and odds ratios for other groups relative to the reference group were calculated. For the three scenarios we considered, the expressions for the logistic regressions are thus as follows:
Substituting and shifting these terms, we get the following:
The odds ratios can thus be expressed as:
4. Discussion
Our first finding is that, in the data we studied, passes rarely happen as scheduled. As we see in Figure 3, the most common scenario at 76% was that train passes are cancelled, followed by unscheduled passes at 21%. Scheduled passes were the least common, at 3%, and 97% of the passes did thus not occur as scheduled. This indicates that the timetable is difficult to realise with a high level of accuracy. It also suggests a high degree of activity among dispatchers to cancel and reschedule train passes, shifting them from one station to another.
Our second finding is that these three types of train passes are associated with very different delay probabilities. As indicated in Figure 4, the probability of delay was highest, 69%, when passes are unscheduled. A cancelled pass was only associated with an 8% probability of delays, while a scheduled pass was in between these two, with a 46% probability of delay. Cancelling a pass is thus a good way to reduce the risk of delays at one station, but it can bring with it a large increase in the probability of delay at another station. For context, when there is no pass, which is the most common situation in operations, there is a 22% probability of dwell time delays—better than when there is a scheduled pass, but worse than if there is a cancelled pass.
4.1. Regression Results
The results from the regression models are found in Table 2 and show essentially the same trend as Figure 4: delays are much less likely when passes are cancelled and much more likely when they are unscheduled, compared to when they happen as scheduled. The odds ratios were about 0.1 and 2.6, respectively, in both models—where a value lower than 1 indicates a reduced risk and above 1 indicates an increase.
To be more specific, the estimated odds of a dwell time delay was 2.6 times higher if a pass was unscheduled rather than scheduled. When a scheduled pass was cancelled, the estimated odds of there not being a dwell time delay was instead 1/0.102 = 9.8. The reduced risk of delays when scheduled passes were cancelled highlights the possibility to improve timetables going forward, and of trying to reduce the need for passes. The results also suggest that the cancellation of a train pass can be used as a tool to avoid severe delays during disturbances, and this is often done in practice. In other cases, however, passes cannot easily be cancelled but must be shifted from one station to another, where it appears as an unscheduled pass and then greatly increases the probability of delay.
4.2. Model Evaluation
In this study, 80% of the data were used for training the model, while 20% was used to test the model. The performance from the testing set for the logistic regression model was measured with the receiver operating characteristic (ROC) curve. The Receiver Operator Characteristic (ROC) curve was a probability curve that plots the true positive rate (another name for recall) against the false positive rate (FPR) where:
where TP is the number of true positives, and FN is the number of false negatives. The recall is intuitively understood as the ability of the classifier to find all the positive samples. The FPR is the ratio of negative instances that are incorrectly classified as positive:
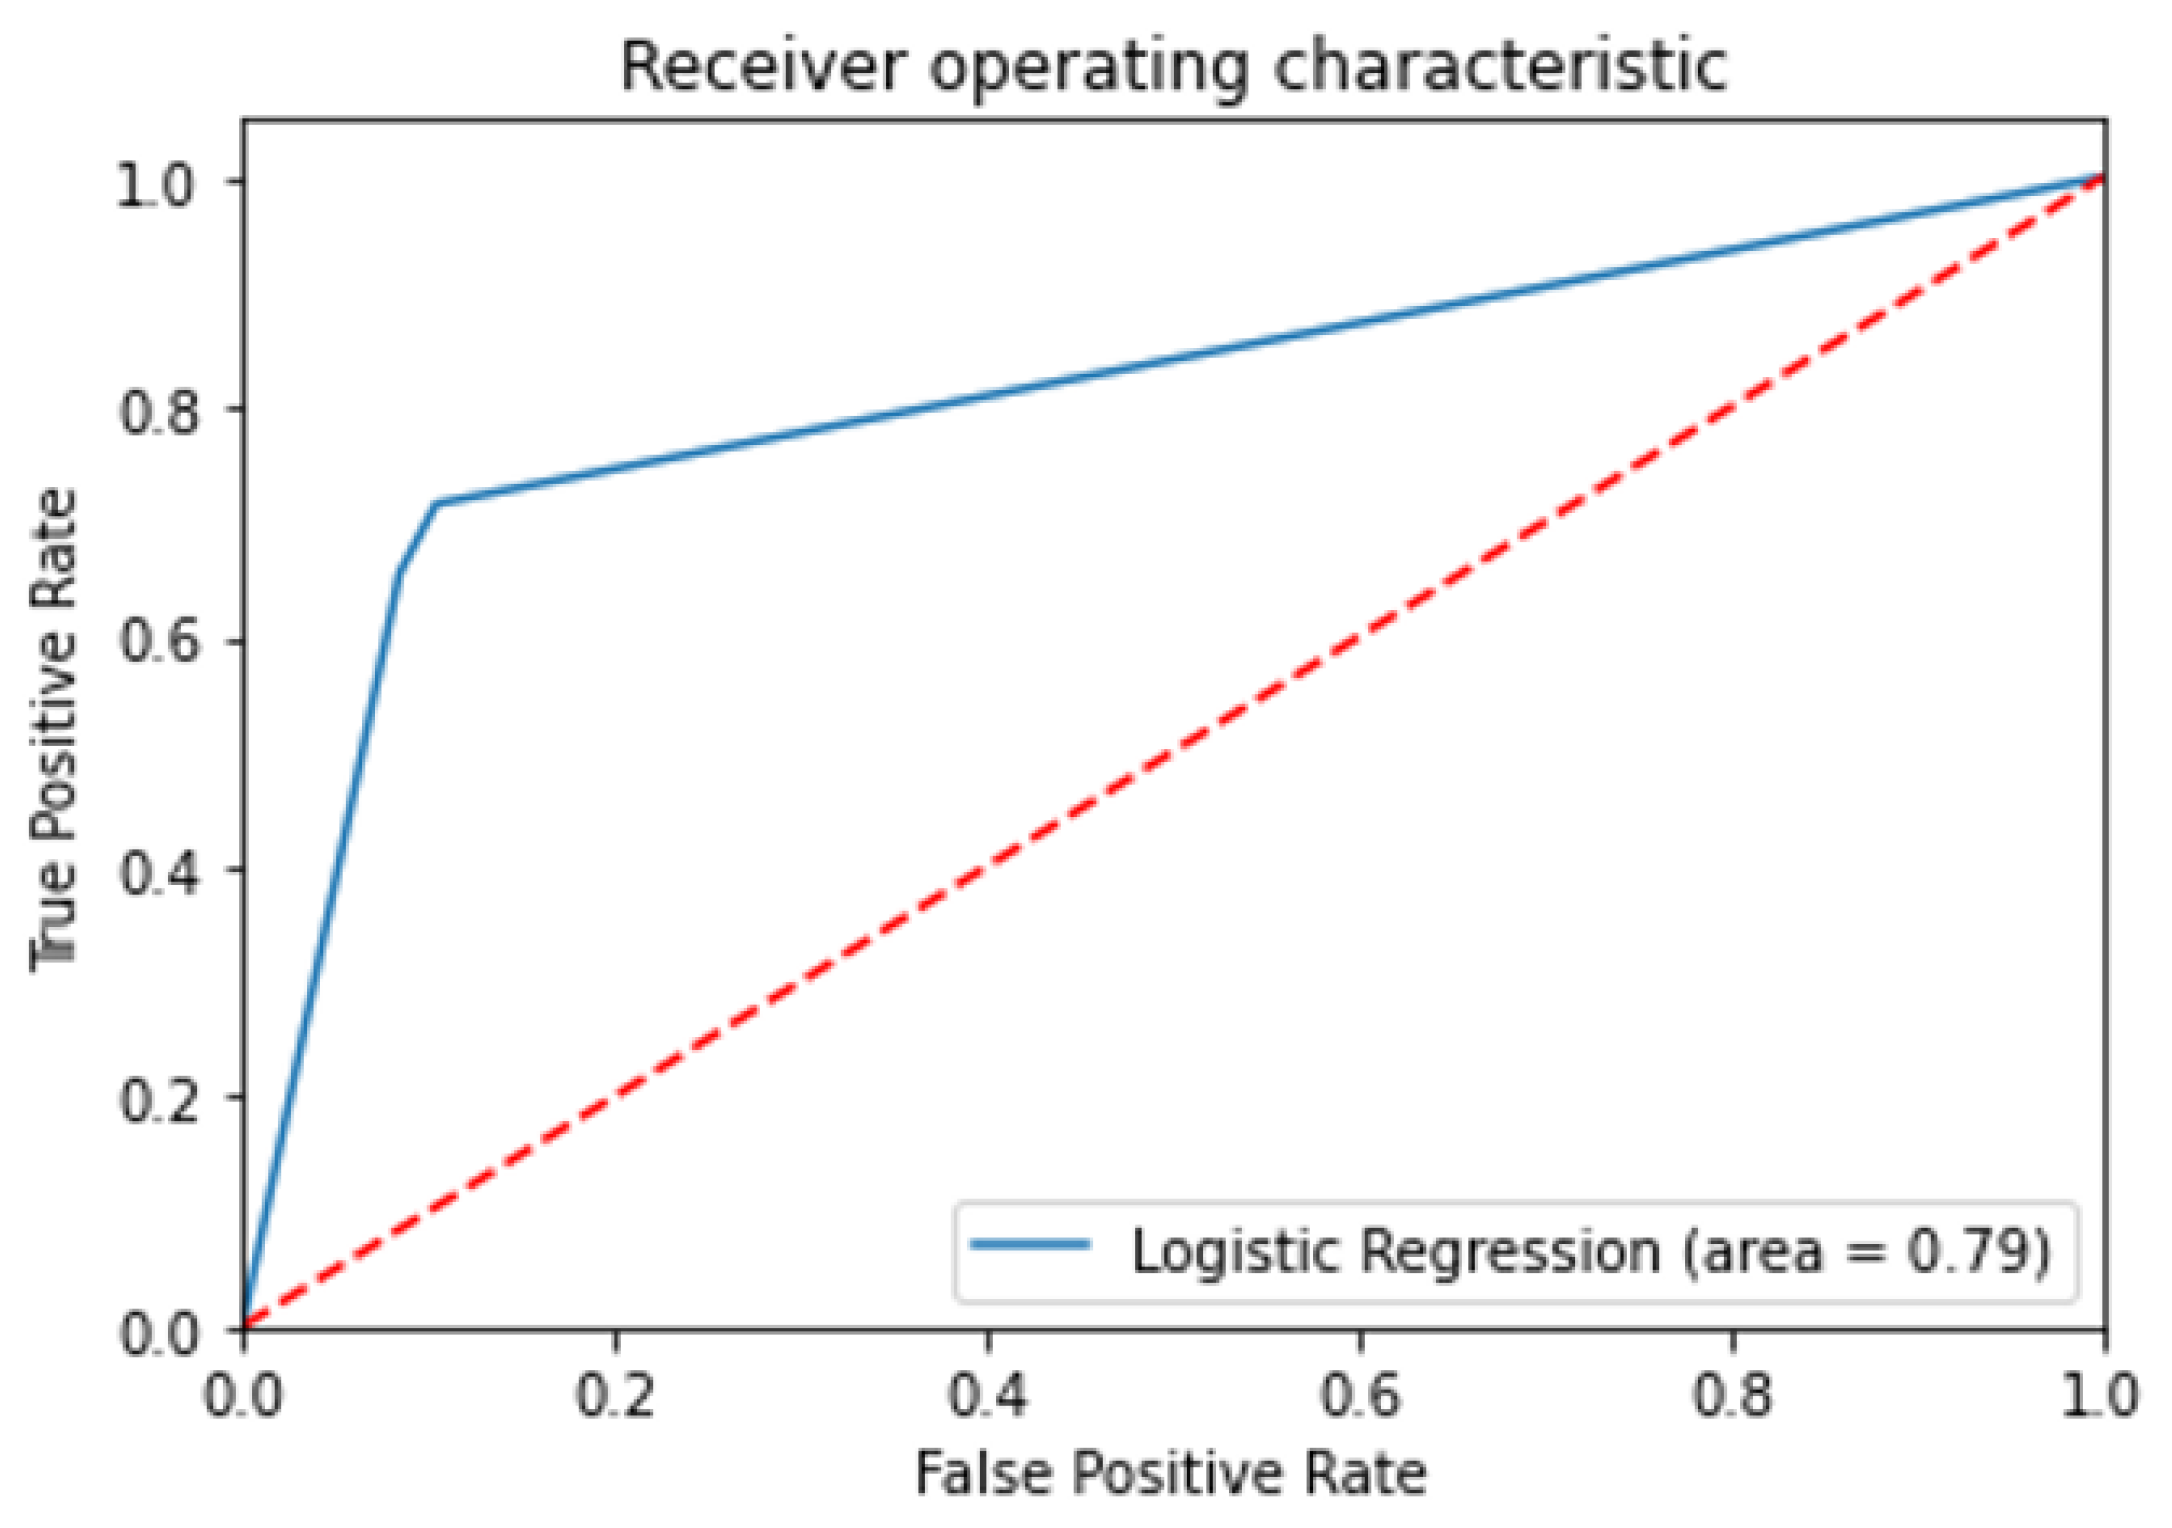
The Area Under the Curve (AUC) is a summary of the ROC curve that measures a classifier’s capacity to distinguish between classes. A perfect classifier will have an Area Under the Curve of Receiver Characteristic Operator (AUC-ROC) equal to 1, whereas a purely random classifier will have an AUC-ROC equal to 0.5. In Figure 5, the AUC-ROC of the model used in this study is 0.79.
5. Conclusions
This analysis has shown two things: First, only a small percentage (3%) of train passes happened as scheduled, with most (76%) being cancelled and a substantial percentage (21%) being unscheduled. This indicates that there are significantly fewer train passes in actual operations than in timetables and that dispatchers play a very active role in shifting the location of passes.
Second, we showed that train passes can significantly alter the probability of delays at a station. Compared to when they happened as scheduled, the odds of delays were reduced by about 9.8 times when passes are cancelled. On the other hand, the odds of delay increased by about 2.6 times if a pass is unscheduled, suggesting a low flexibility of the timetable. While cancelling a pass at one station can be used to mitigate the possibility of delays there, there will then either be an unscheduled pass at another station, thus greatly increasing the odds of delays at the following station, or the train will not pass and may need to run at a reduced speed.
One of the main advantages of using logistic regression is that it is not a “black box” and that it is easy to interpret. However, the model is associated with several limitations and simplifications. Firstly, our model only accounts for different types of passes and omits many other variables (including other types of train interactions and conflicts). Secondly, it is based on macroscopic train operations data, on a station-by-station level, rather than signal-by-signal, which would be more precise. Finally, the value indicates that the model can only explain around 30% of the variance in dwell time delays and that is only when considering the relatively small part of the data that includes some sort of (scheduled, cancelled, or unscheduled) pass. Including more variables, such as passenger data, other types of train movements, weather conditions, detailed timetable information, infrastructure failures, and so on, as well as using more complex models, would most likely improve the overall predictive power of the model. However, that would not necessarily teach us more about the effects of different types of train passes.
In future work, we will continue to explore other possible types of interactions such as meets, headway interactions, trains turning around at the terminal station, or trains stopping for passenger transfers. The approach used in this study can also be used to evaluate the consequences of dispatching actions and trade-offs and can help dispatchers make well-informed decisions that improve railway capacity and punctuality. Another direction for future research into train passes is to complement the simplified approach used in this study with more complex models, such as various machine learning algorithms, which tend to be more opaque and difficult to interpret but which can offer much higher predictive power. Similarly, combining data on different types of passes (and other interactions) with other sources of data (such as weather, passengers, etc.) can further increase the ability to predict and understand train delays.
Author Contributions
Methodology, K.Y.T. and C.-W.P.; formal analysis, K.Y.T.; writing—original draft preparation, K.Y.T. and C.-W.P.; writing—review and editing, K.Y.T., C.-W.P. and N.O.E.O.; visualisation, K.Y.T.; supervision, C.-W.P. and N.O.E.O.; funding acquisition, C.-W.P. All authors have read and agreed to the published version of the manuscript.
Funding
This work was funded by the Swedish Transport Administration, grant number TRV2018/139443.
Institutional Review Board Statement
Not applicable.
Informed Consent Statement
Not applicable.
Data Availability Statement
Research data are not shared due to confidentiality reasons.
Acknowledgments
The earlier version of this manuscript was presented at The 9th International Conference on Railway Operations Modelling and Analysis (ICROMA), and the authors would like to thank the anonymous reviewers there for their constructive comments.
Conflicts of Interest
The authors declare no conflict of interest.
References
- Trafikanalys. Punctuality on Railway 2017; Trafikanalys: Stockholm, Sweden, 2018; Available online: https://www.trafa.se/bantrafik/punktlighet-pa-jarnvag/ (accessed on 3 May 2020).
- Palmqvist, C.W. Delays and Timetabling for Passenger Trains. Ph.D. Thesis, Lund University, Lund, Sweden, 2019. [Google Scholar]
- Andersson, E.V. Assessment of Robustness in Railway Traffic Timetables. Ph.D. Thesis, Linköping University Electronic Press, Linkoping, Sweden, 2014. [Google Scholar]
- Nie, L.; Hansen, I.A. System analysis of train operations and track occupancy at railway stations. Eur. J. Transp. Infrastruct. Res. 2005, 5. [Google Scholar] [CrossRef]
- Carey, M.; Kwieciński, A. Stochastic approximation to the effects of headways on knock-on delays of trains. Transp. Res. Part Methodol. 1994, 28, 251–267. [Google Scholar] [CrossRef]
- Goverde, R.M.; Hansen, I.A. Performance indicators for railway timetables. In Proceedings of the 2013 IEEE International Conference on Intelligent rail Transportation Proceedings, Beijing, China, 30 August–1 September 2013; pp. 301–306. [Google Scholar]
- D’Ariano, A.; Pranzo, M. An advanced real-time train dispatching system for minimizing the propagation of delays in a dispatching area under severe disturbances. Netw. Spat. Econ. 2009, 9, 63–84. [Google Scholar] [CrossRef] [Green Version]
- Lindfeldt, A. Railway Capacity Analysis: Methods for Simulation and Evaluation of Timetables, Delays and Infrastructure. Ph.D. Thesis, KTH Royal Institute of Technology, Stockholm, Sweden, 2015. [Google Scholar]
- Liang, J.; Martin, U.; Cui, Y. Increasing performance of railway systems by exploitation of the relationship between capacity and operation quality. J. Rail Transp. Plan. Manag. 2017, 7, 127–140. [Google Scholar] [CrossRef]
- Carey, M.; Carville, S. Testing schedule performance and reliability for train stations. J. Oper. Res. Soc. 2000, 51, 666–682. [Google Scholar] [CrossRef]
- Sparing, D.; Goverde, R.M. A cycle time optimization model for generating stable periodic railway timetables. Transp. Res. Part Methodol. 2017, 98, 198–223. [Google Scholar] [CrossRef]
- Lee, W.H.; Yen, L.H.; Chou, C.M. A delay root cause discovery and timetable adjustment model for enhancing the punctuality of railway services. Transp. Res. Part Emerg. Technol. 2016, 73, 49–64. [Google Scholar] [CrossRef]
- Li, X.; Huo, Y.; Yan, Z.; Han, B. An optimization method for operation adjustment of high-speed delayed trains. Discret. Dyn. Nat. Soc. 2019, 2019, 9846970. [Google Scholar] [CrossRef]
- Keiji, K.; Naohiko, H.; Shigeru, M. Simulation analysis of train operation to recover knock-on delay under high-frequency intervals. Case Stud. Transp. Policy 2015, 3, 92–98. [Google Scholar] [CrossRef]
- Galapitage, A.; Albrecht, A.R.; Pudney, P.; Vu, X.; Zhou, P. Optimal real-time junction scheduling for trains with connected driver advice systems. J. Rail Transp. Plan. Manag. 2018, 8, 29–41. [Google Scholar] [CrossRef]
- Bulíček, J. Cancellation of delayed trains: Passengers’ and capacity points of view. In MATEC Web of Conferences; EDP Sciences: Les Ulis, France, 2018; Volume 235, p. 00022. [Google Scholar]
- Corman, F.; D’Ariano, A.; Hansen, I.A. Disruption handling in large railway networks. WIT Trans. Built Environ. 2010, 114, 629–640. [Google Scholar]
- Gorman, M.F. Statistical estimation of railroad congestion delay. Transp. Res. Part Logist. Transp. Rev. 2009, 45, 446–456. [Google Scholar] [CrossRef]
- Palmqvist, C.W. Excess probability of dwell time delays from train meets and passes. J. Rail Transp. Plan. Manag. 2022, 21, 100298. [Google Scholar] [CrossRef]
- Trafikanalys. Punctuality on Railway 2019; Trafikanalys: Stockholm, Sweden, 2020; Available online: https://www.trafa.se/bantrafik/punktlighet-pa-jarnvag/ (accessed on 3 May 2020).
- Wagenmakers, E.J.; Farrell, S. AIC model selection using Akaike weights. Psychon. Bull. Rev. 2004, 11, 192–196. [Google Scholar] [CrossRef] [PubMed]
- Yuan, J.; Hansen, I.A. Optimizing capacity utilization of stations by estimating knock-on train delays. Transp. Res. Part Methodol. 2007, 41, 202–217. [Google Scholar] [CrossRef]
- Harris, N.G.; Mjøsund, C.S.; Haugland, H. Improving railway performance in Norway. J. Rail Transp. Plan. Manag. 2013, 3, 172–180. [Google Scholar] [CrossRef]
- Tang, J.; Zheng, L.; Han, C.; Yin, W.; Zhang, Y.; Zou, Y.; Huang, H. Statistical and machine-learning methods for clearance time prediction of road incidents: A methodology review. Anal. Methods Accid. Res. 2020, 27, 100123. [Google Scholar] [CrossRef]
Figure 1.
Double tracks as separate independent systems.

Figure 2.
Scenario with different types of train passes.

Figure 3.
Distribution of different types of train passes.

Figure 4.
Probability of dwell time delays for different types of train passes.

Figure 5.
ROC curves for Logistic Regression Model.


Table 1.
Different types of train pass scenarios.
| Scheduled Operations | No Pass | Pass | |
|---|---|---|---|
| Actual Operations | |||
| No pass | No pass | Cancelled pass | |
| Pass | Unscheduled pass | Scheduled pass |
Table 2.
Summary of logistic regression models.
| Predictor | Estimate | Odds Ratio (OR) | Confidence Interval | |
|---|---|---|---|---|
| Lower | Upper | |||
| (Intercept) | −0.152 *** | |||
| Train passes: | ||||
| Cancelled pass | −2.283 *** | 0.102 | 0.098 | 0.107 |
| Unscheduled pass | 0.952 *** | 2.592 | 2.479 | 2.710 |
| R2 | 0.310 | |||
*** indicates statistically significant with p-value .
Publisher’s Note: MDPI stays neutral with regard to jurisdictional claims in published maps and institutional affiliations. |
© 2022 by the authors. Licensee MDPI, Basel, Switzerland. This article is an open access article distributed under the terms and conditions of the Creative Commons Attribution (CC BY) license (https://creativecommons.org/licenses/by/4.0/).
Share and Cite
MDPI and ACS Style
Tiong, K.Y.; Palmqvist, C.-W.; Olsson, N.O.E. The Effects of Train Passes on Dwell Time Delays in Sweden. Appl. Sci. 2022, 12, 2775. https://doi.org/10.3390/app12062775
AMA Style
Tiong KY, Palmqvist C-W, Olsson NOE. The Effects of Train Passes on Dwell Time Delays in Sweden. Applied Sciences. 2022; 12(6):2775. https://doi.org/10.3390/app12062775
Chicago/Turabian StyleTiong, Kah Yong, Carl-William Palmqvist, and Nils O. E. Olsson. 2022. "The Effects of Train Passes on Dwell Time Delays in Sweden" Applied Sciences 12, no. 6: 2775. https://doi.org/10.3390/app12062775
Note that from the first issue of 2016, this journal uses article numbers instead of page numbers. See further details here.