

Analysis of Civil Environments Cleaning Services—Microbiological and LCA Analysis after Traditional and Sustainable Procedures

 ,
,  , ,
, , 

Abstract
:1. Introduction
2. Materials and Methods
2.1. Cleaning Plan
2.2. Sampling Plan and Microbiological Evaluation
Swabs and Plates
2.3. Microbial Isolation and Identification
2.4. Cleaning Procedure
- -
- Use of scrub cloths in TT treated at higher temperatures (60 °C) than TG (40 °C).
- -
- The use of eco-labelled products for the cleaning of floors and surfaces in TT, with lower dilution of use (2–100%) compared to the products of the experimental protocol TG (dosage 0.8–10%).
- -
- Use of eco-labelled textiles for the cleaning of floors and surfaces in the experimental protocol TG. Specifically, the cloths used for the cleaning of floors passed the test conducted by an independent laboratory following the ISO:23231 as for the release of microplastics in the water of washing and rinsing [19].
- -
PFE Green and Traditional Protocols
2.5. Standard/GREEN Protocol Active Ingredients
2.5.1. Peracetic Acid
2.5.2. Sodium Hypochlorite
2.5.3. Phenylphenol
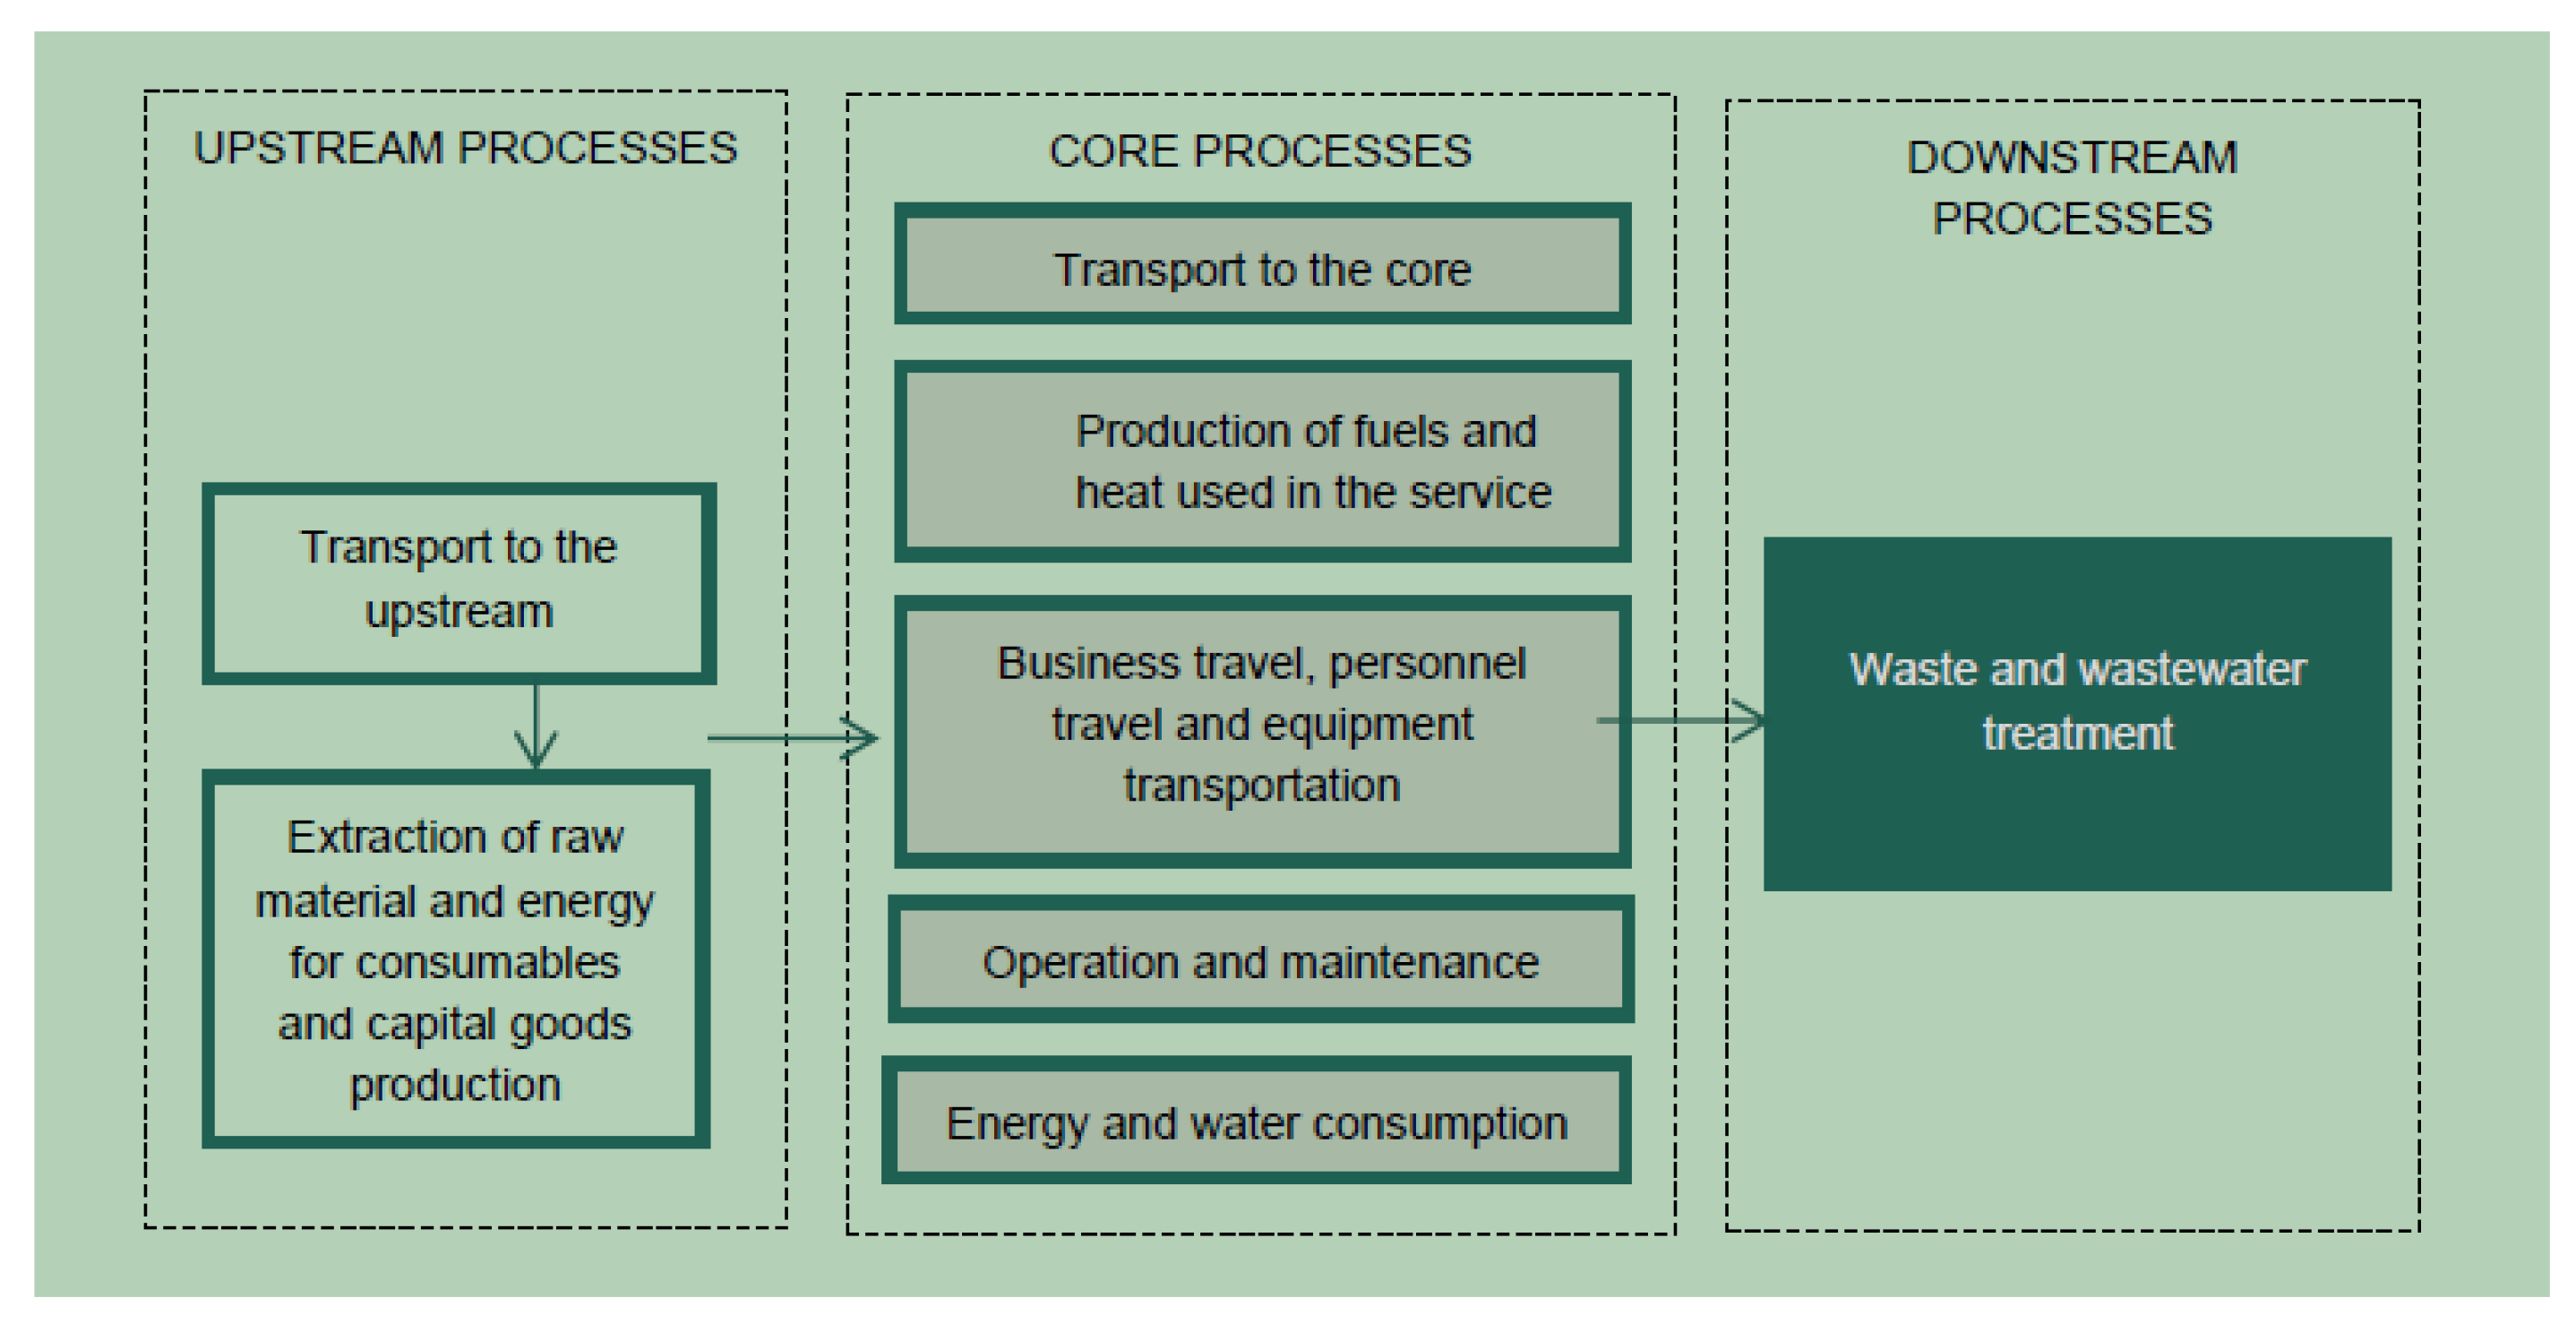
2.6. LCA Analysis
- ●
- The “upstream” phase included:
- ○
- extraction and processing of raw materials;
- ○
- transport of raw materials and semi-finished products to suppliers;
- ○
- the production of consumer goods, namely chemicals (detergents) and textiles (fringes);
- ○
- production of cleaning trolley;
- ○
- the production of machinery (washer and dryer, washing machine).
- ●
- The “core” phase included:
- ○
- the supply chain of consumer goods from producers to the yard;
- ○
- the implementation of the service through the use of chemicals and textiles;
- ○
- production of transport fuels;
- ○
- the production of electricity used in the construction site for the implementation of the service;
- ○
- water consumption for dilution of chemicals and by the washing machine.
- ●
- The “downstream” phase included:
- ○
- the transport and treatment of solid and wastewater generated by the processes of the “core” phase.
- The two systems compared have the same functional unit, they are equivalent in terms of spatial characteristics and interventions;
- Being a comparative analysis study, similar processes have not been considered, for example the transport of personnel at the site, which does not vary between the two protocols;
- The areas investigated are the same;
- The criteria for inclusion of inputs and outputs are identical;
- Data quality requirements are the same;
- Life cycle inventory units are identical;
- The calculation procedures are similar;
- Allocation rules are equivalent;
- The selected impact categories and characterization factors are identical (ISO:14067, GWP100);
- The types of intervention and the frequency of operations are identical;
- The surfaces are comparable by type of floor, functions of use of the property and overall dimensions of the surface itself;
- The degree of use of the sampled areas and dirt level are equivalent;
- As regards electricity consumption, due to the lack of specific data of the yard-specific supply contract, the residual national energy mix has been taken as a precautionary measure;
- The total area of the building is 38,150 sqm.
2.7. Statistical Analysis
3. Results and Discussion
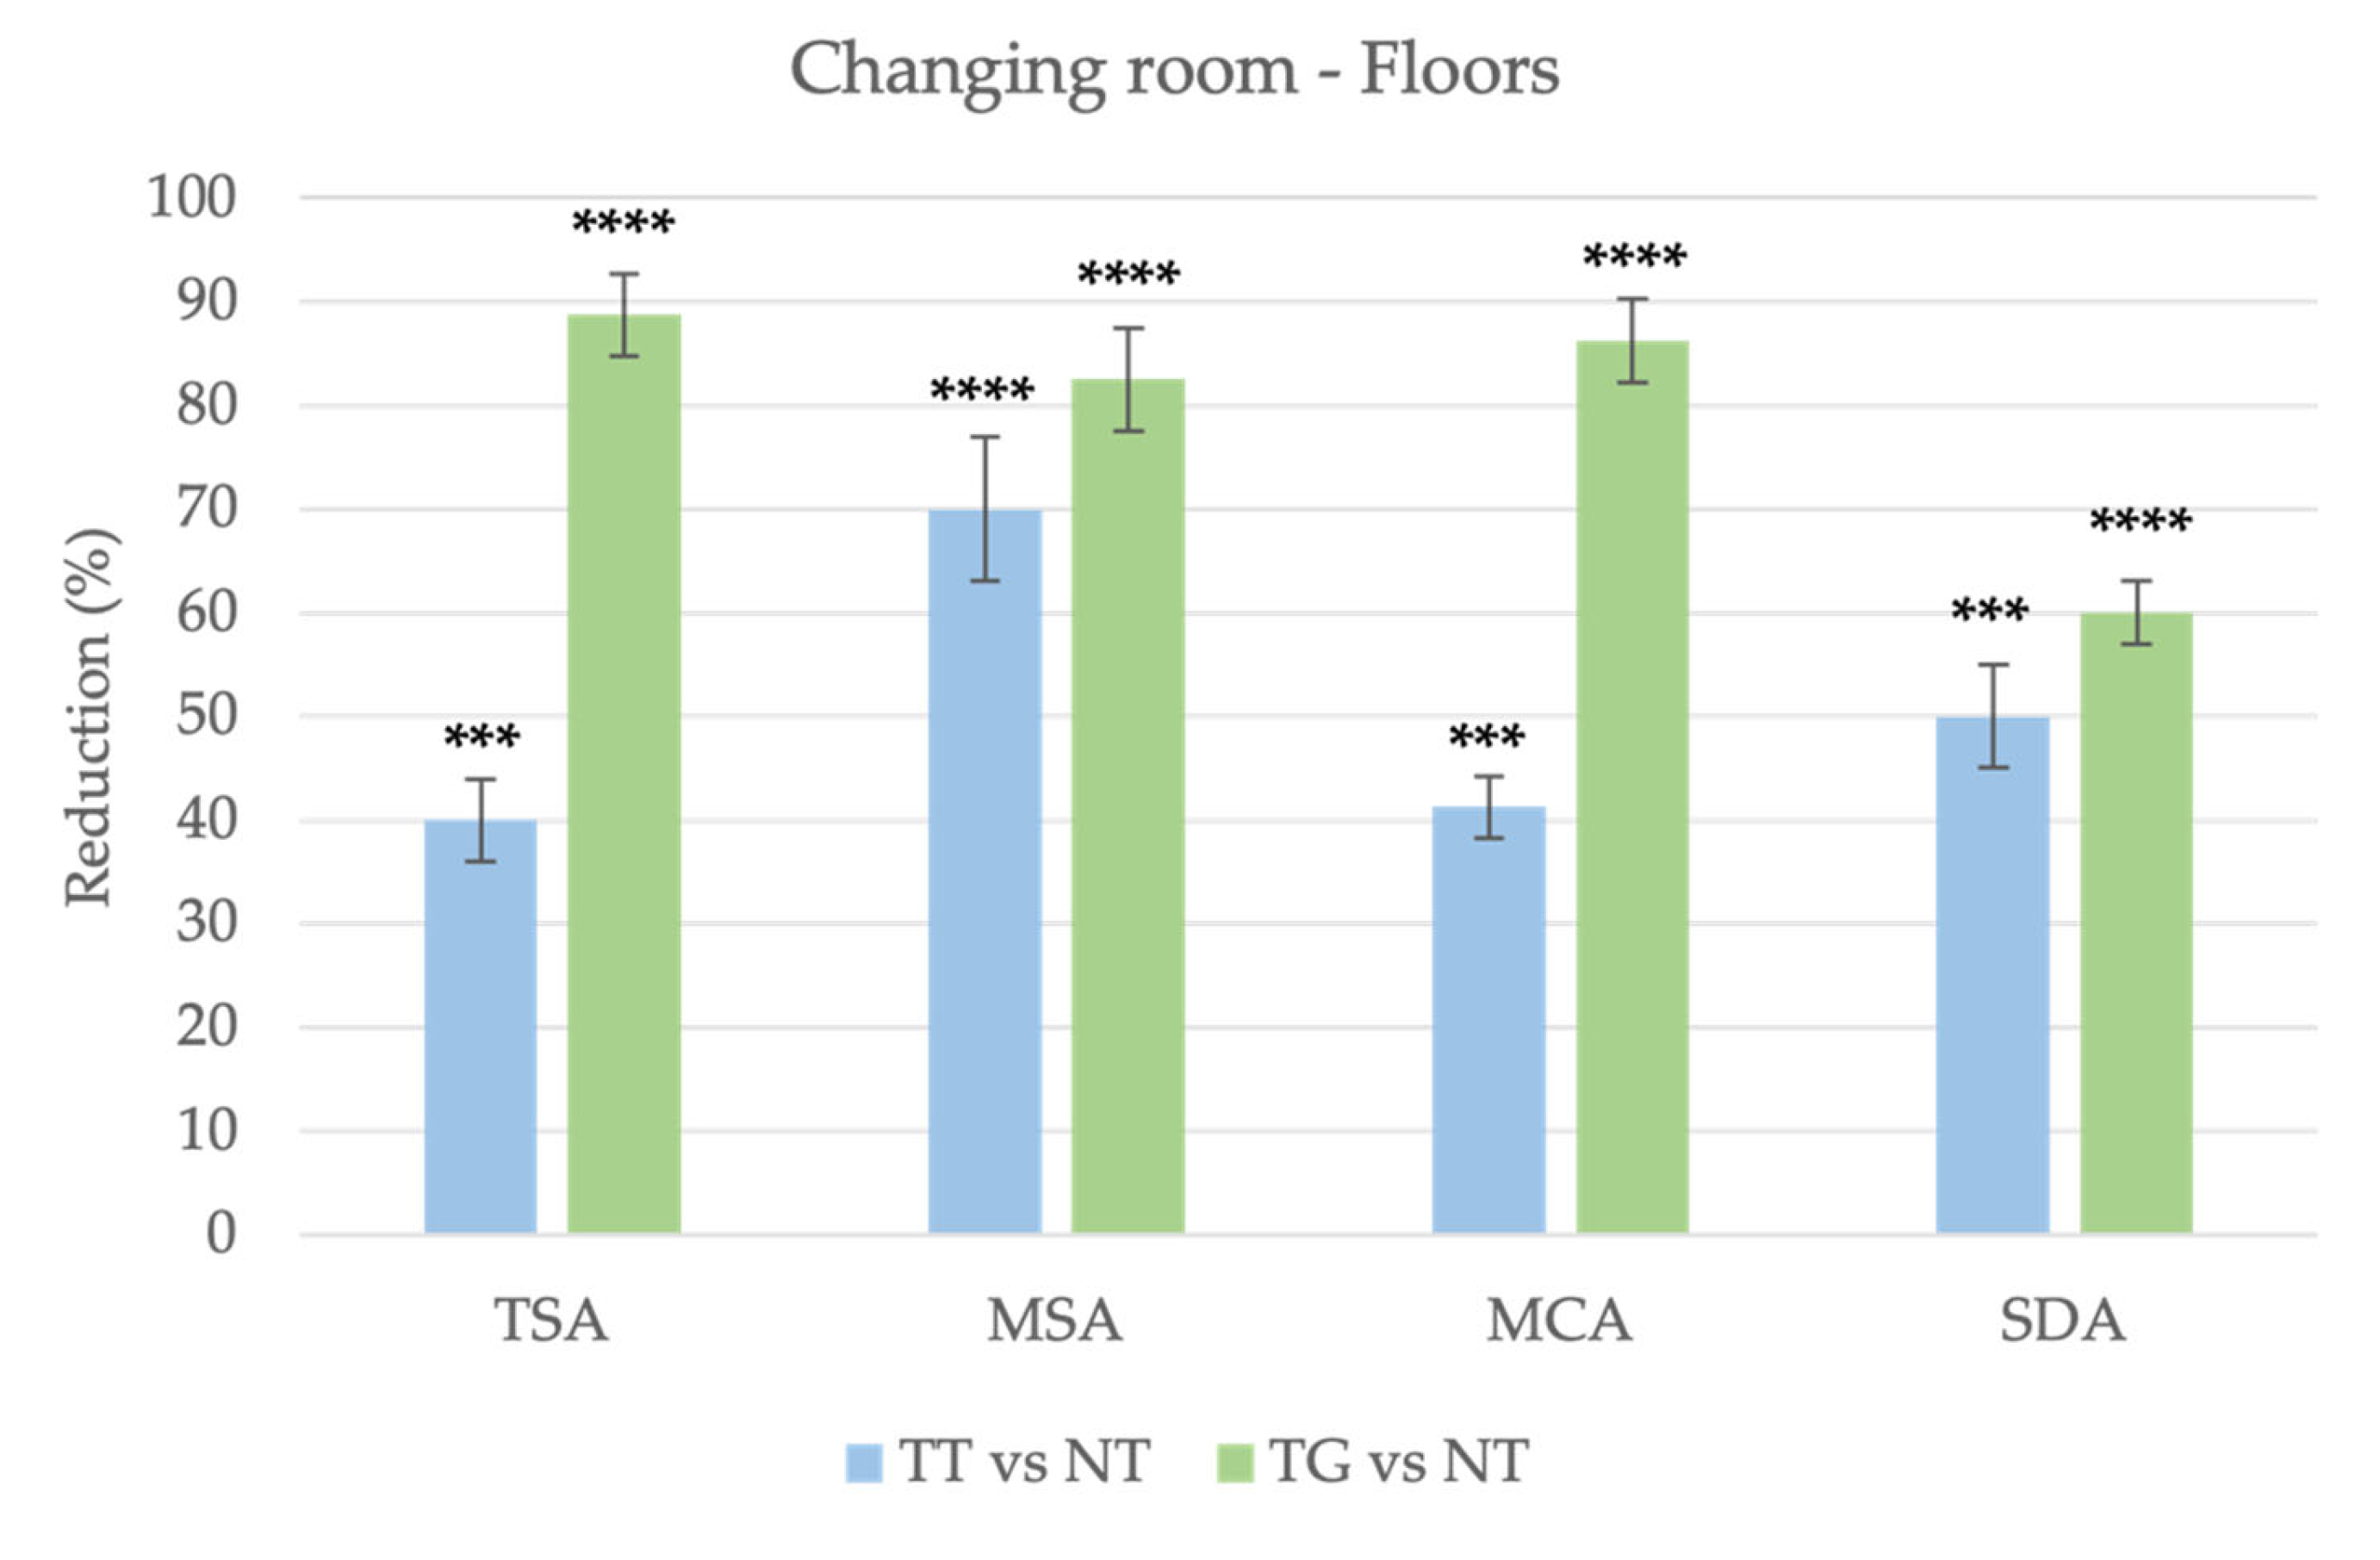
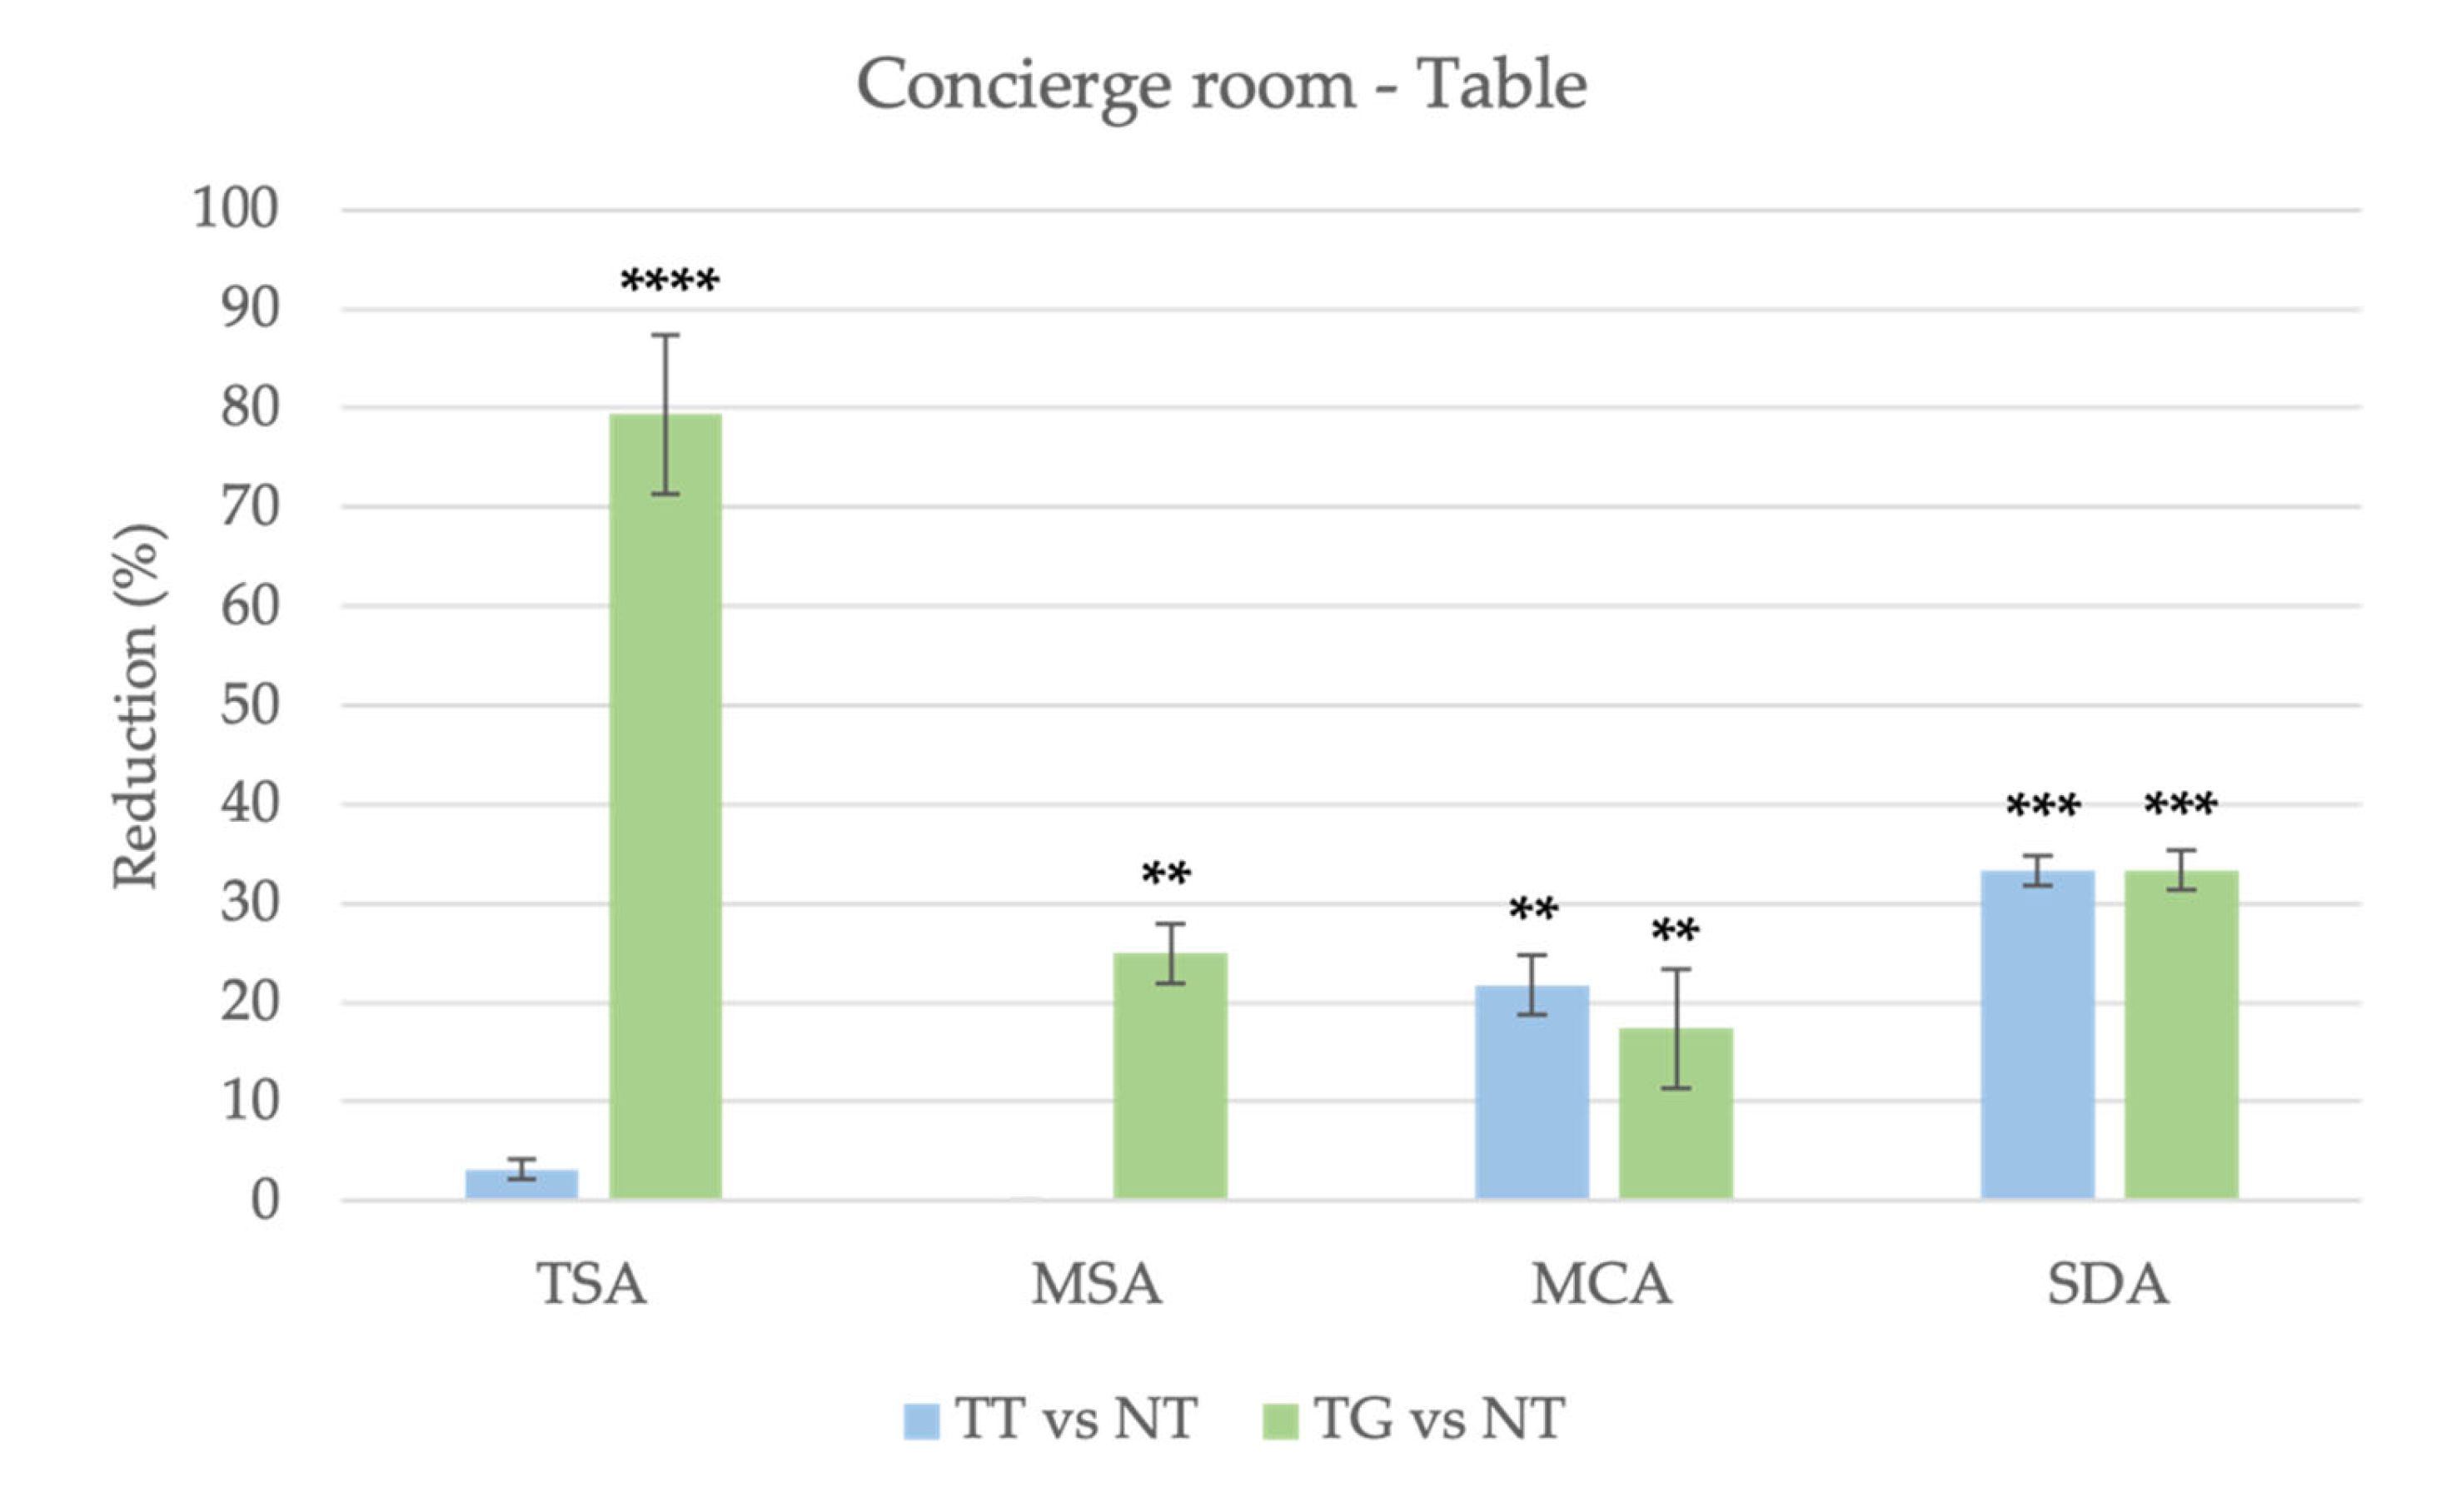
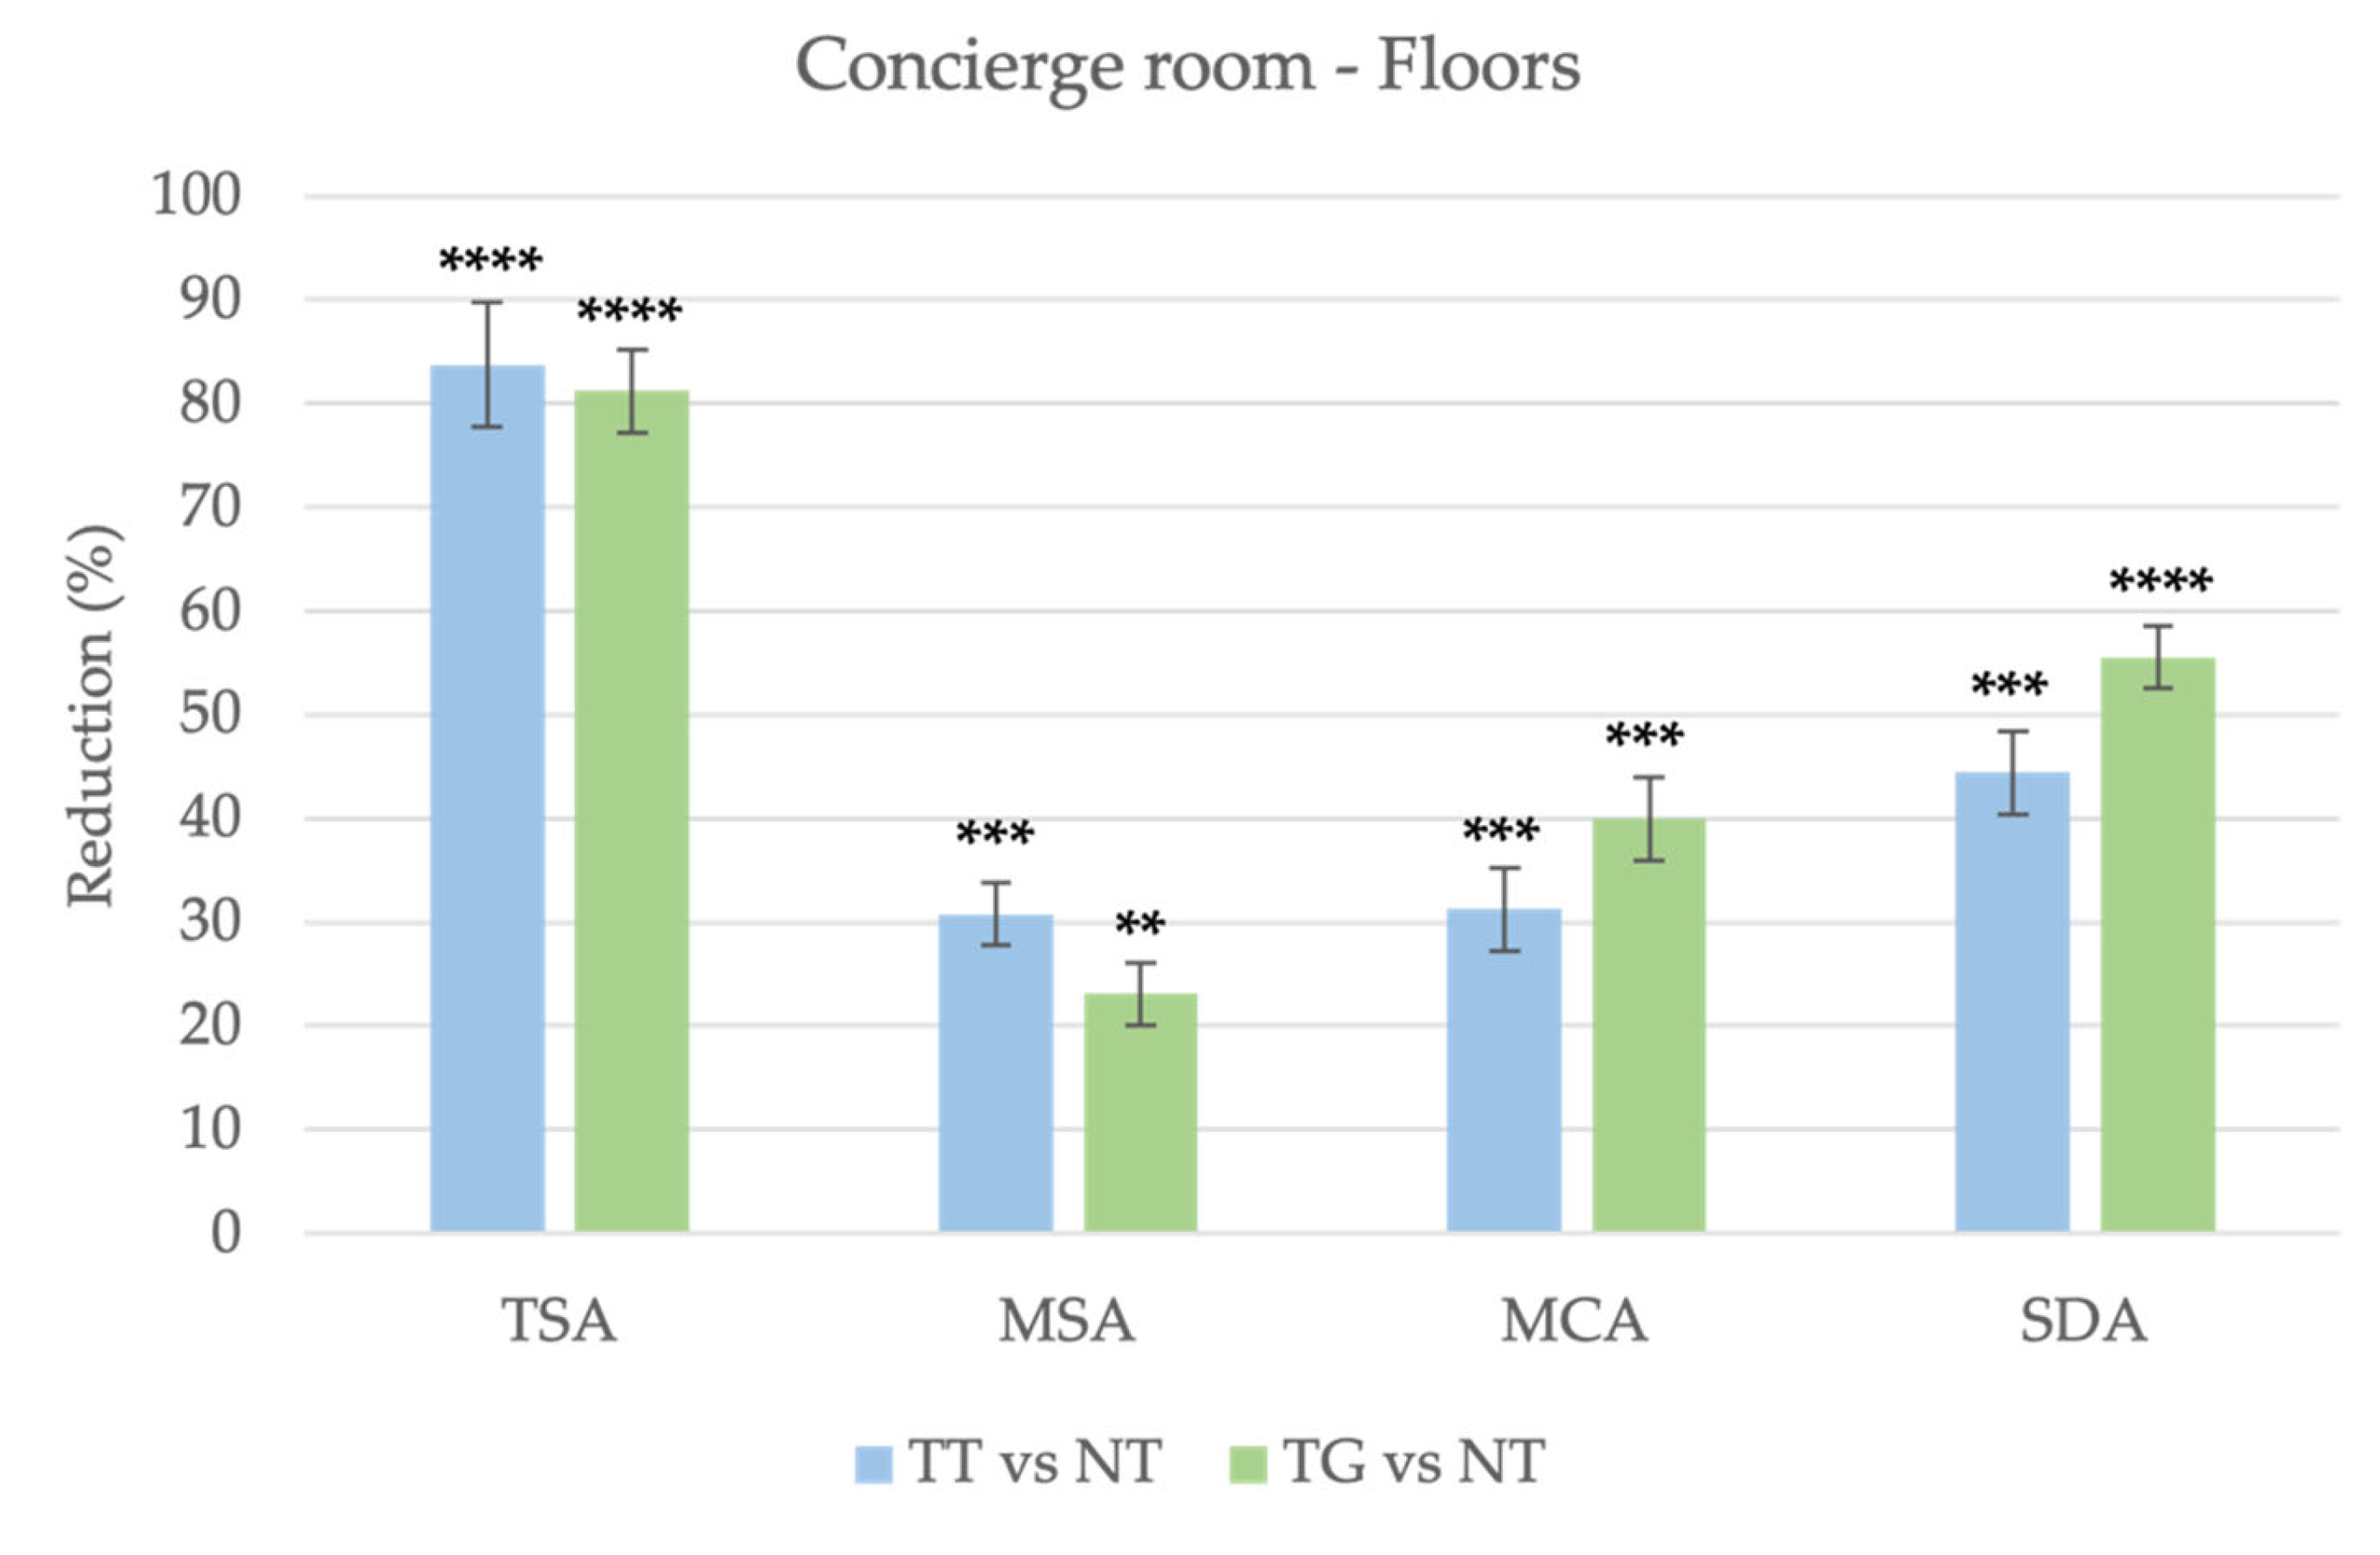
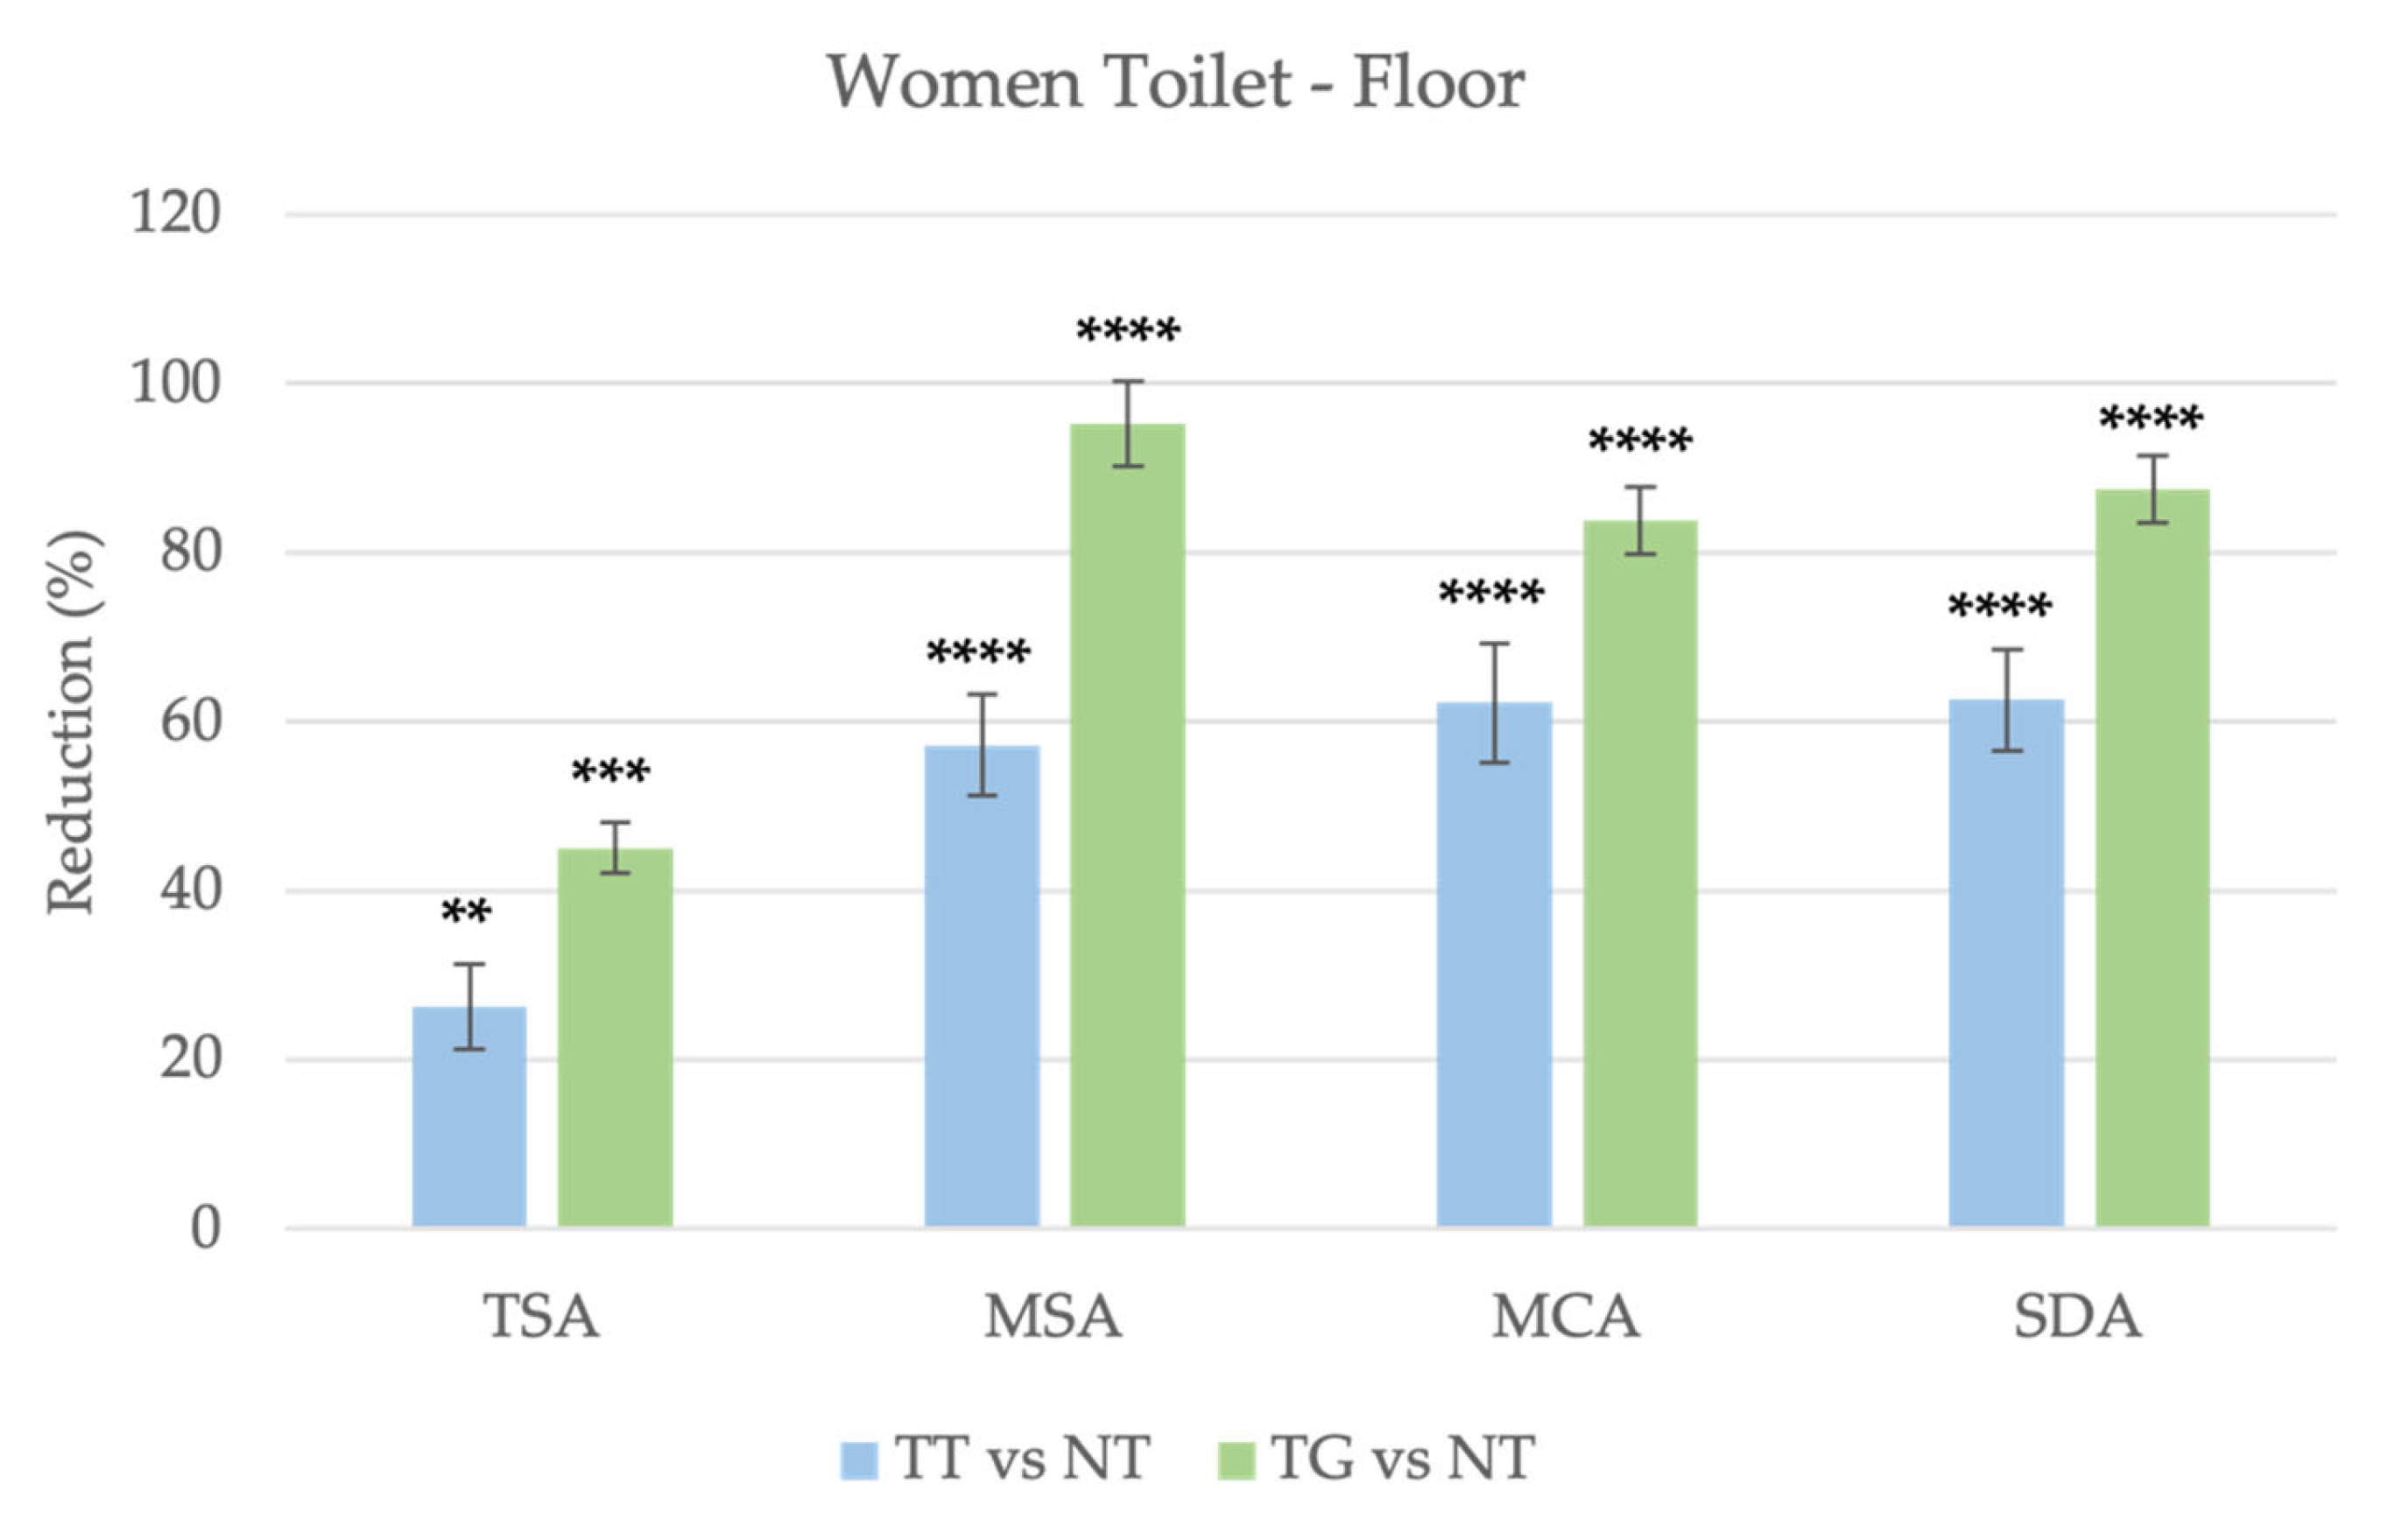
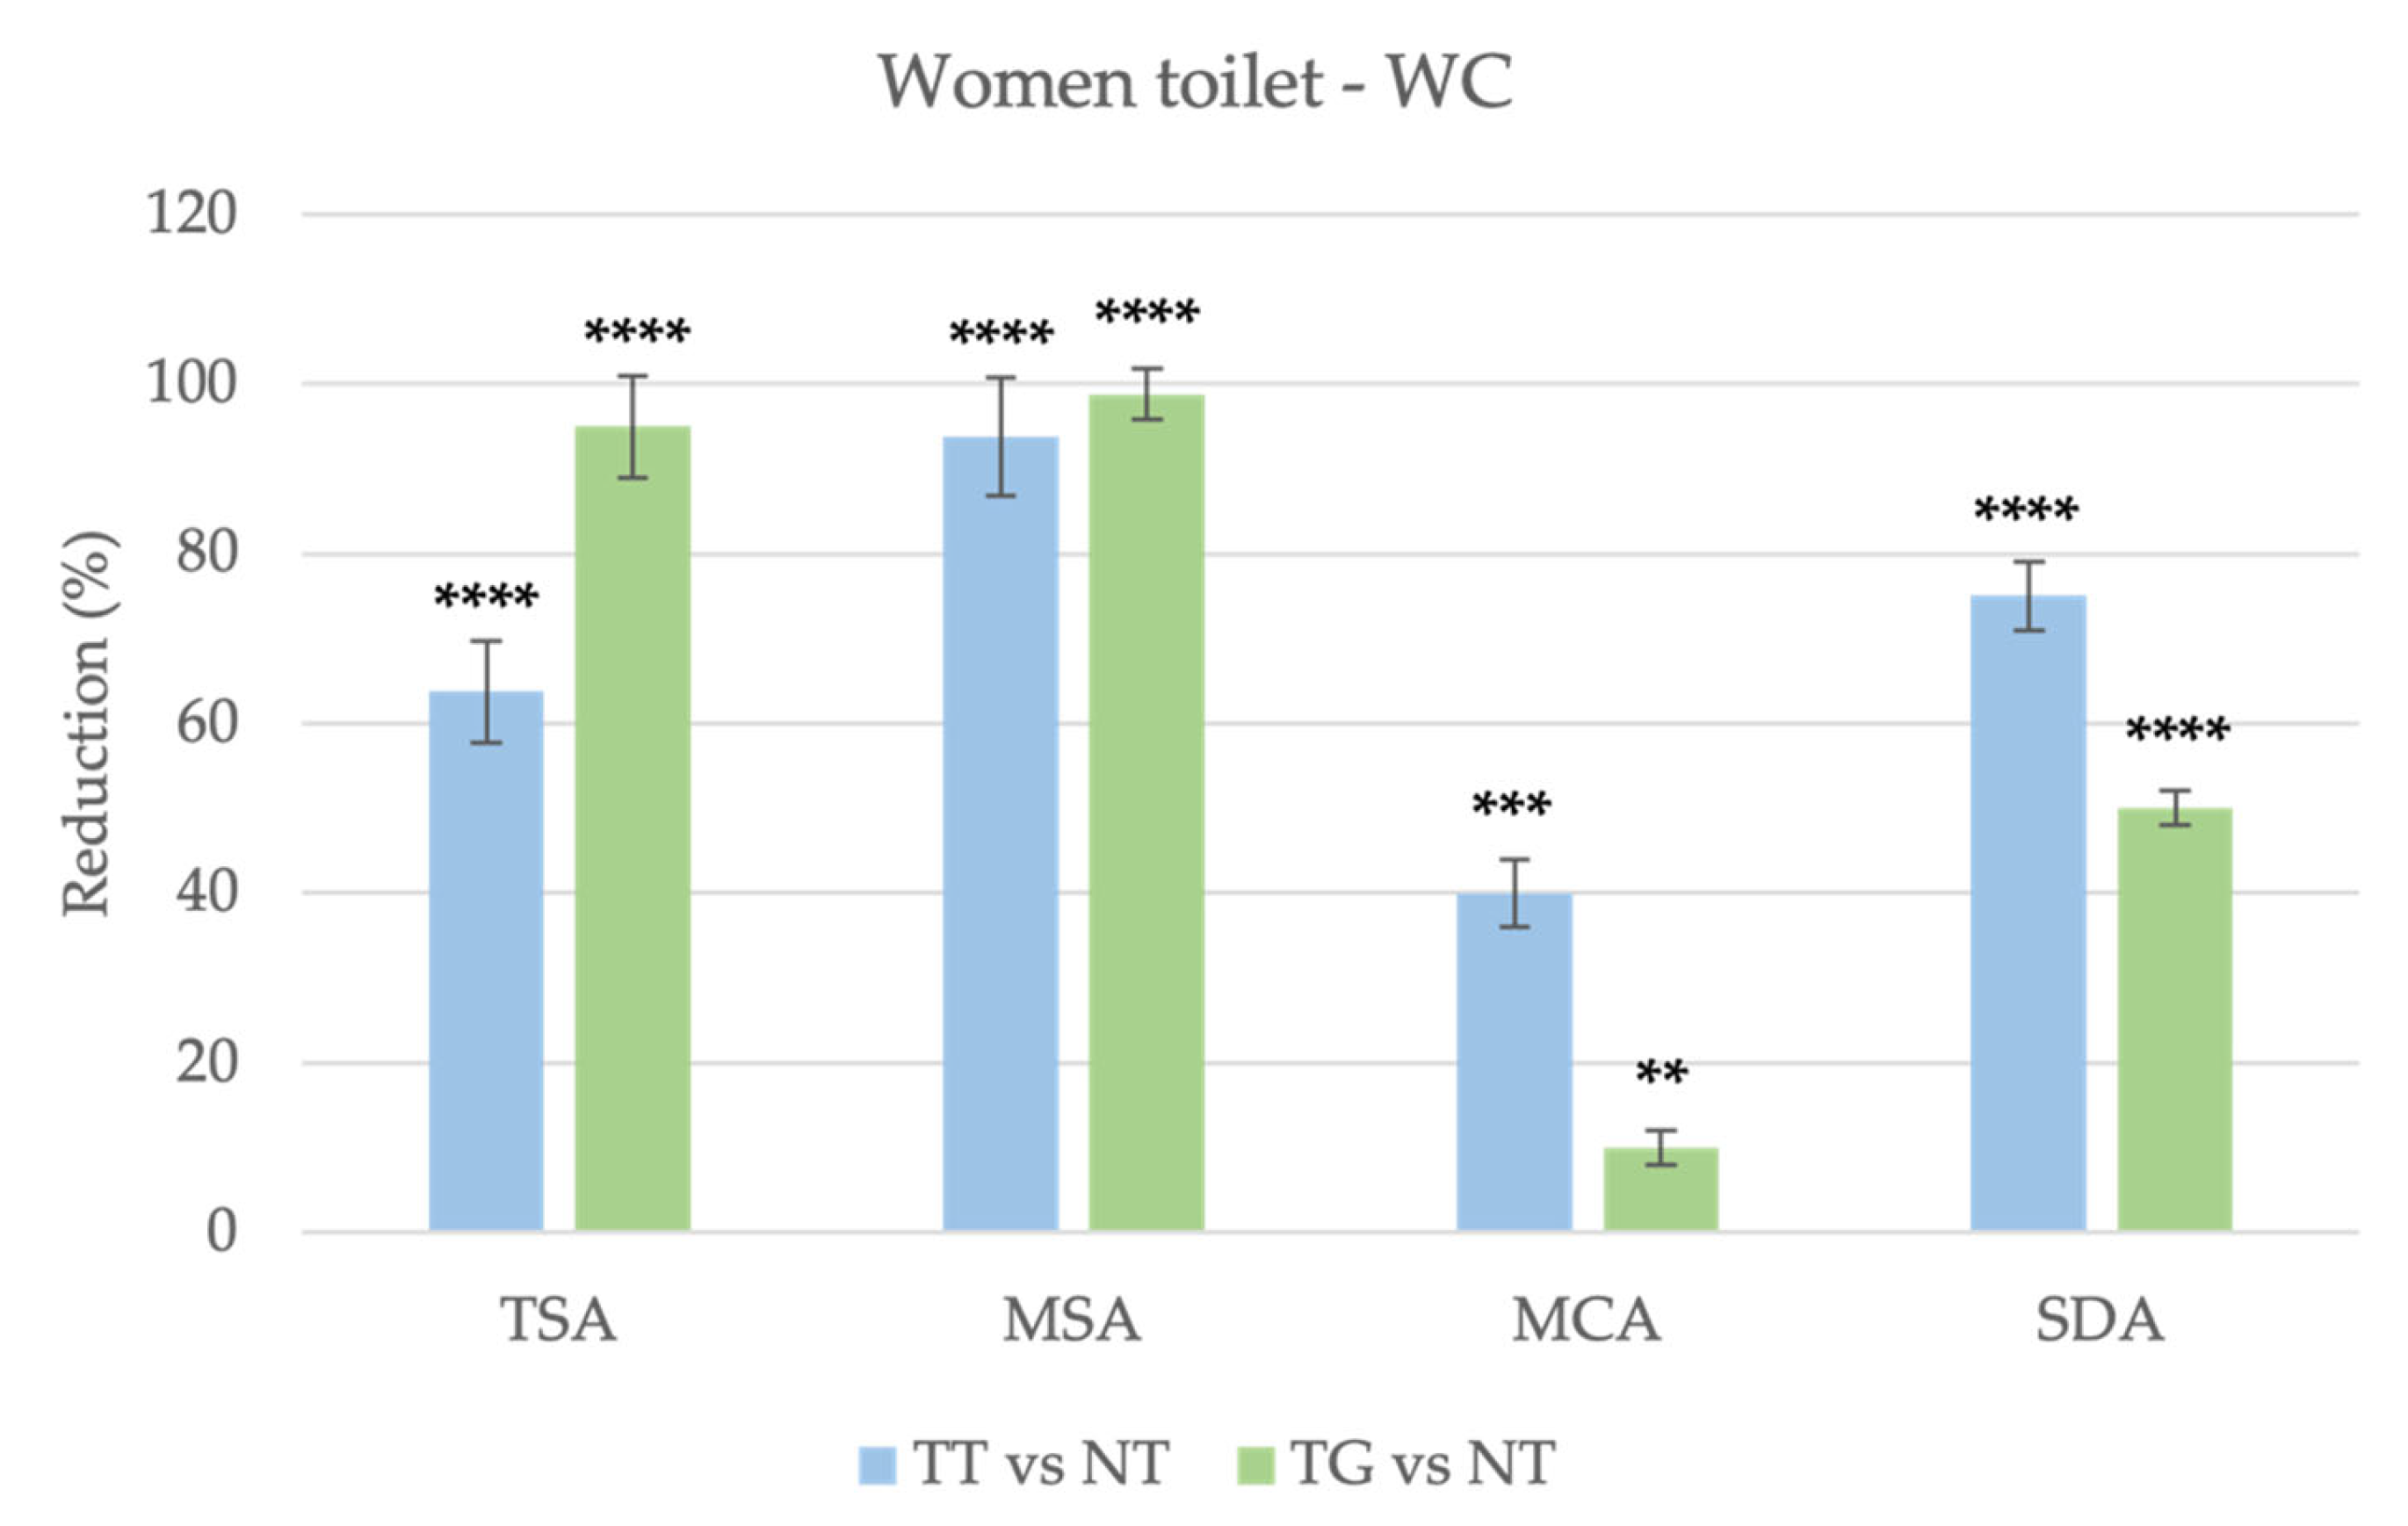
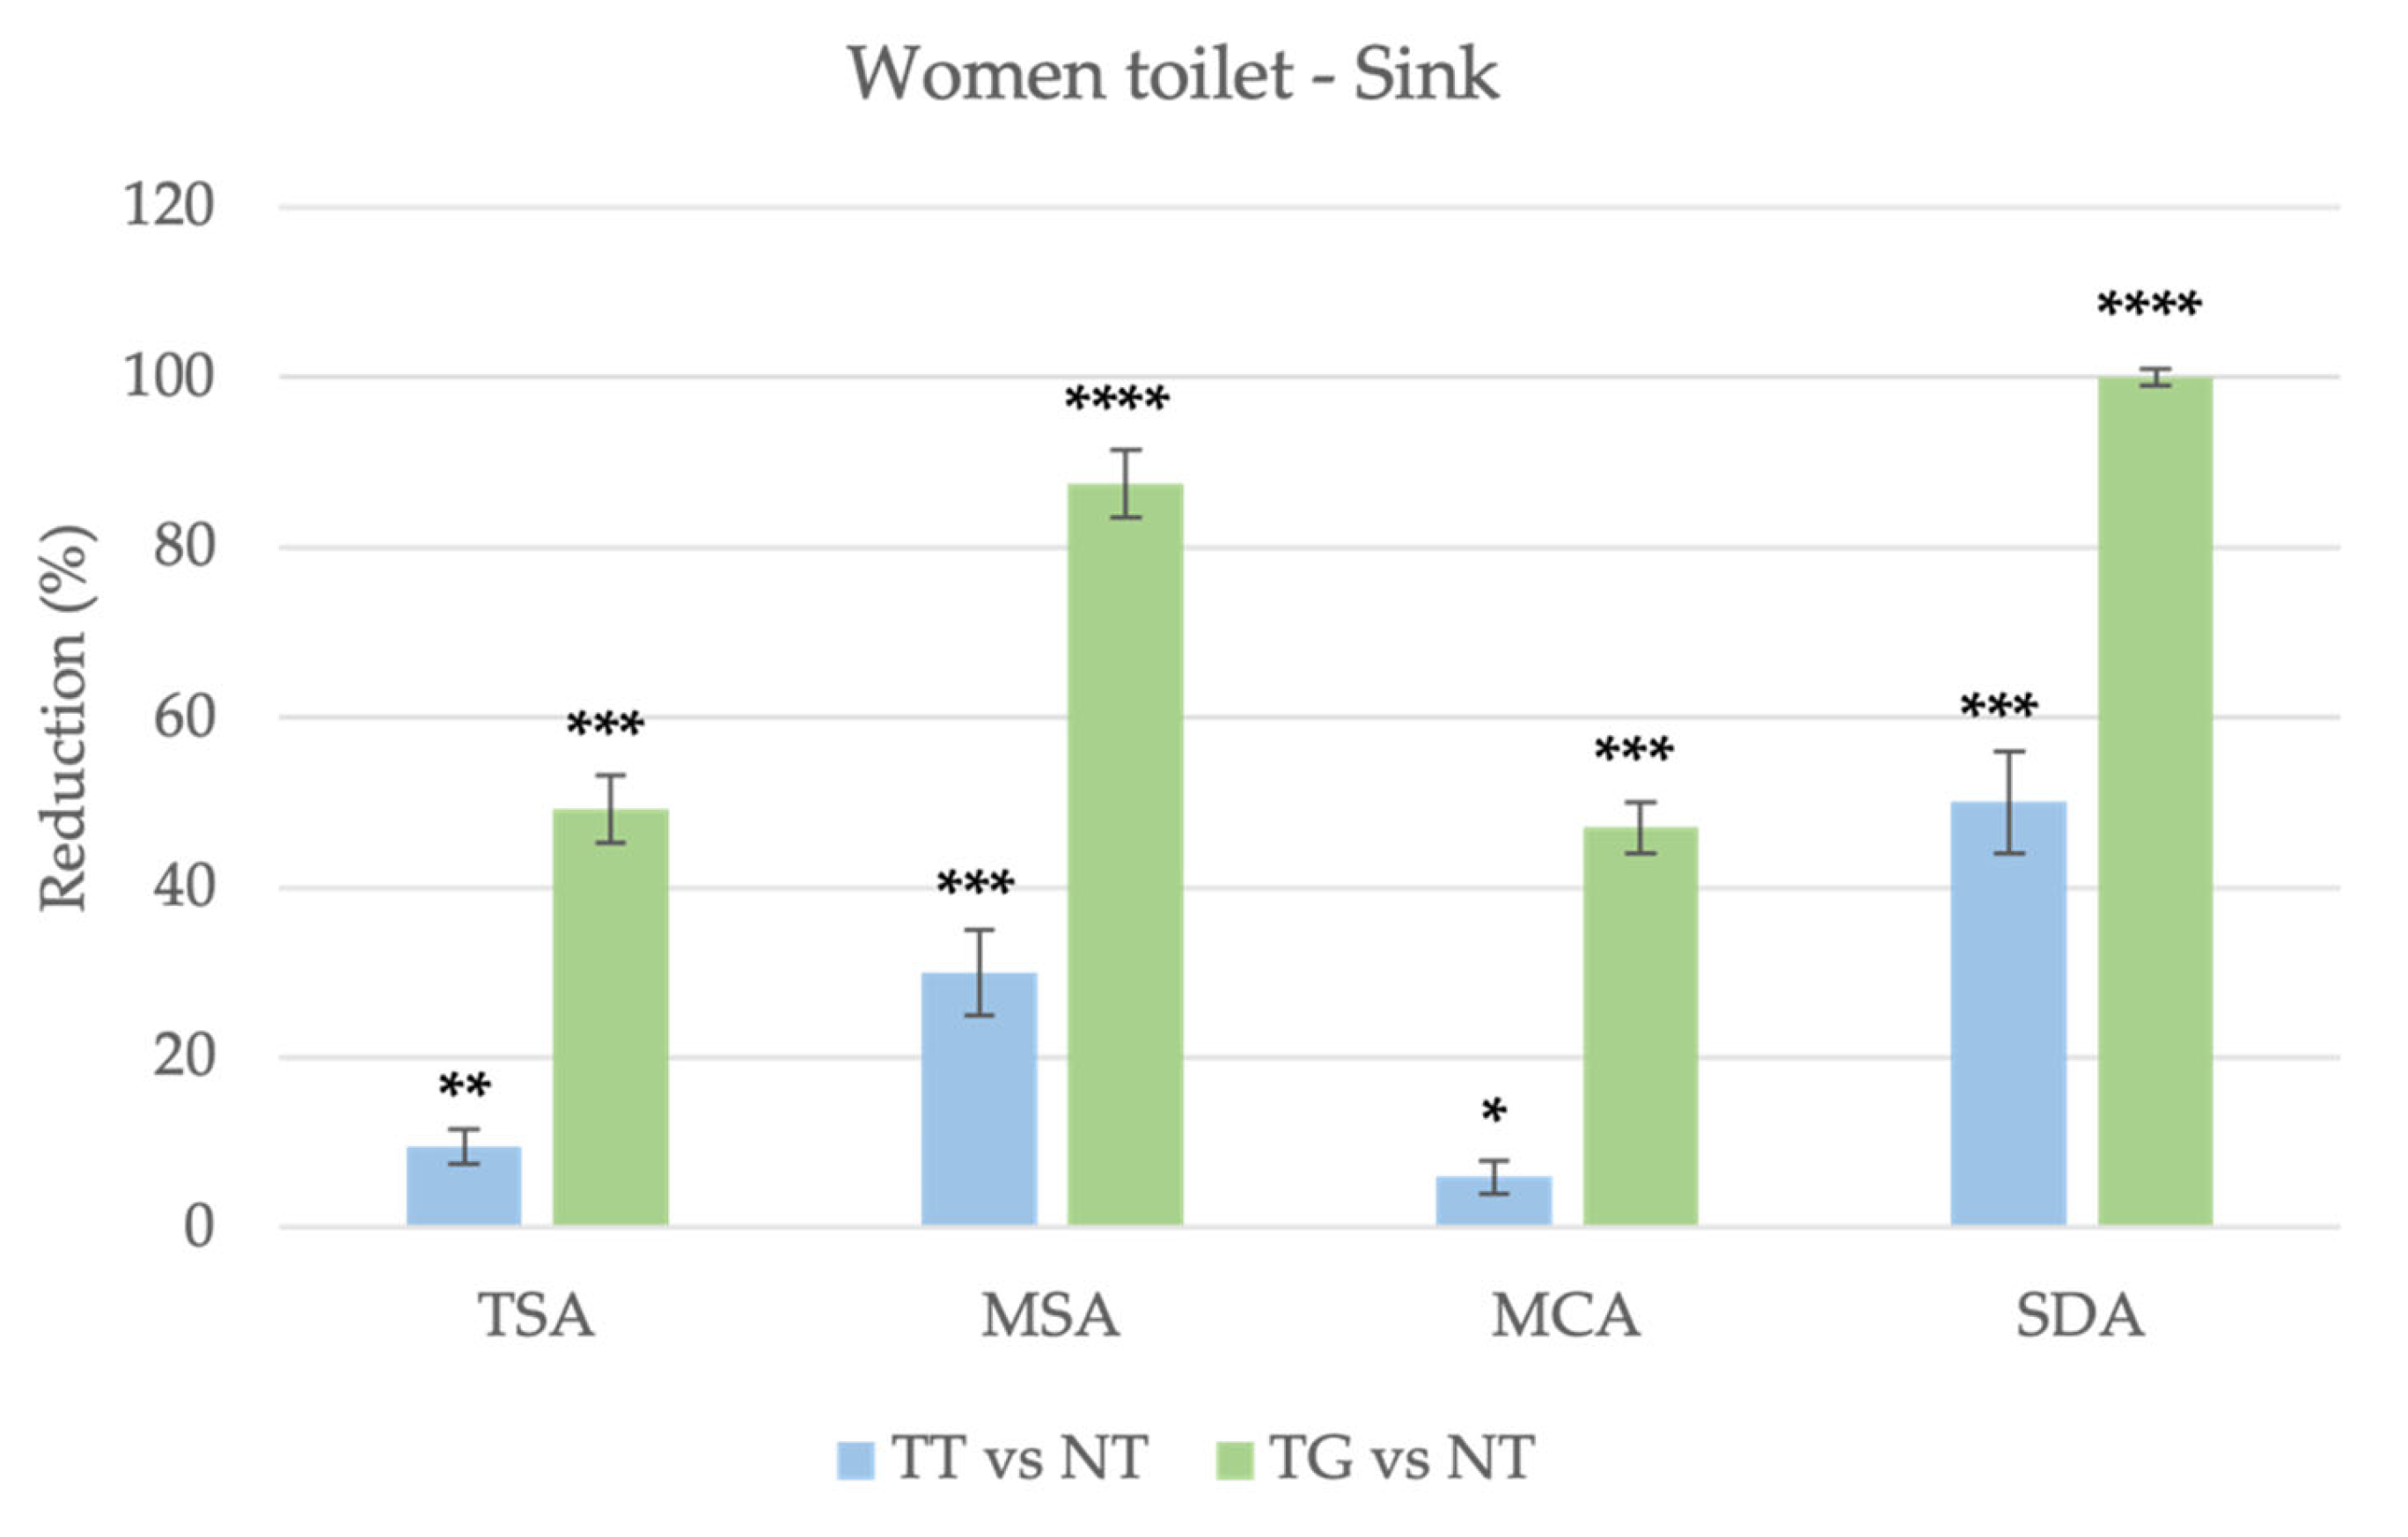
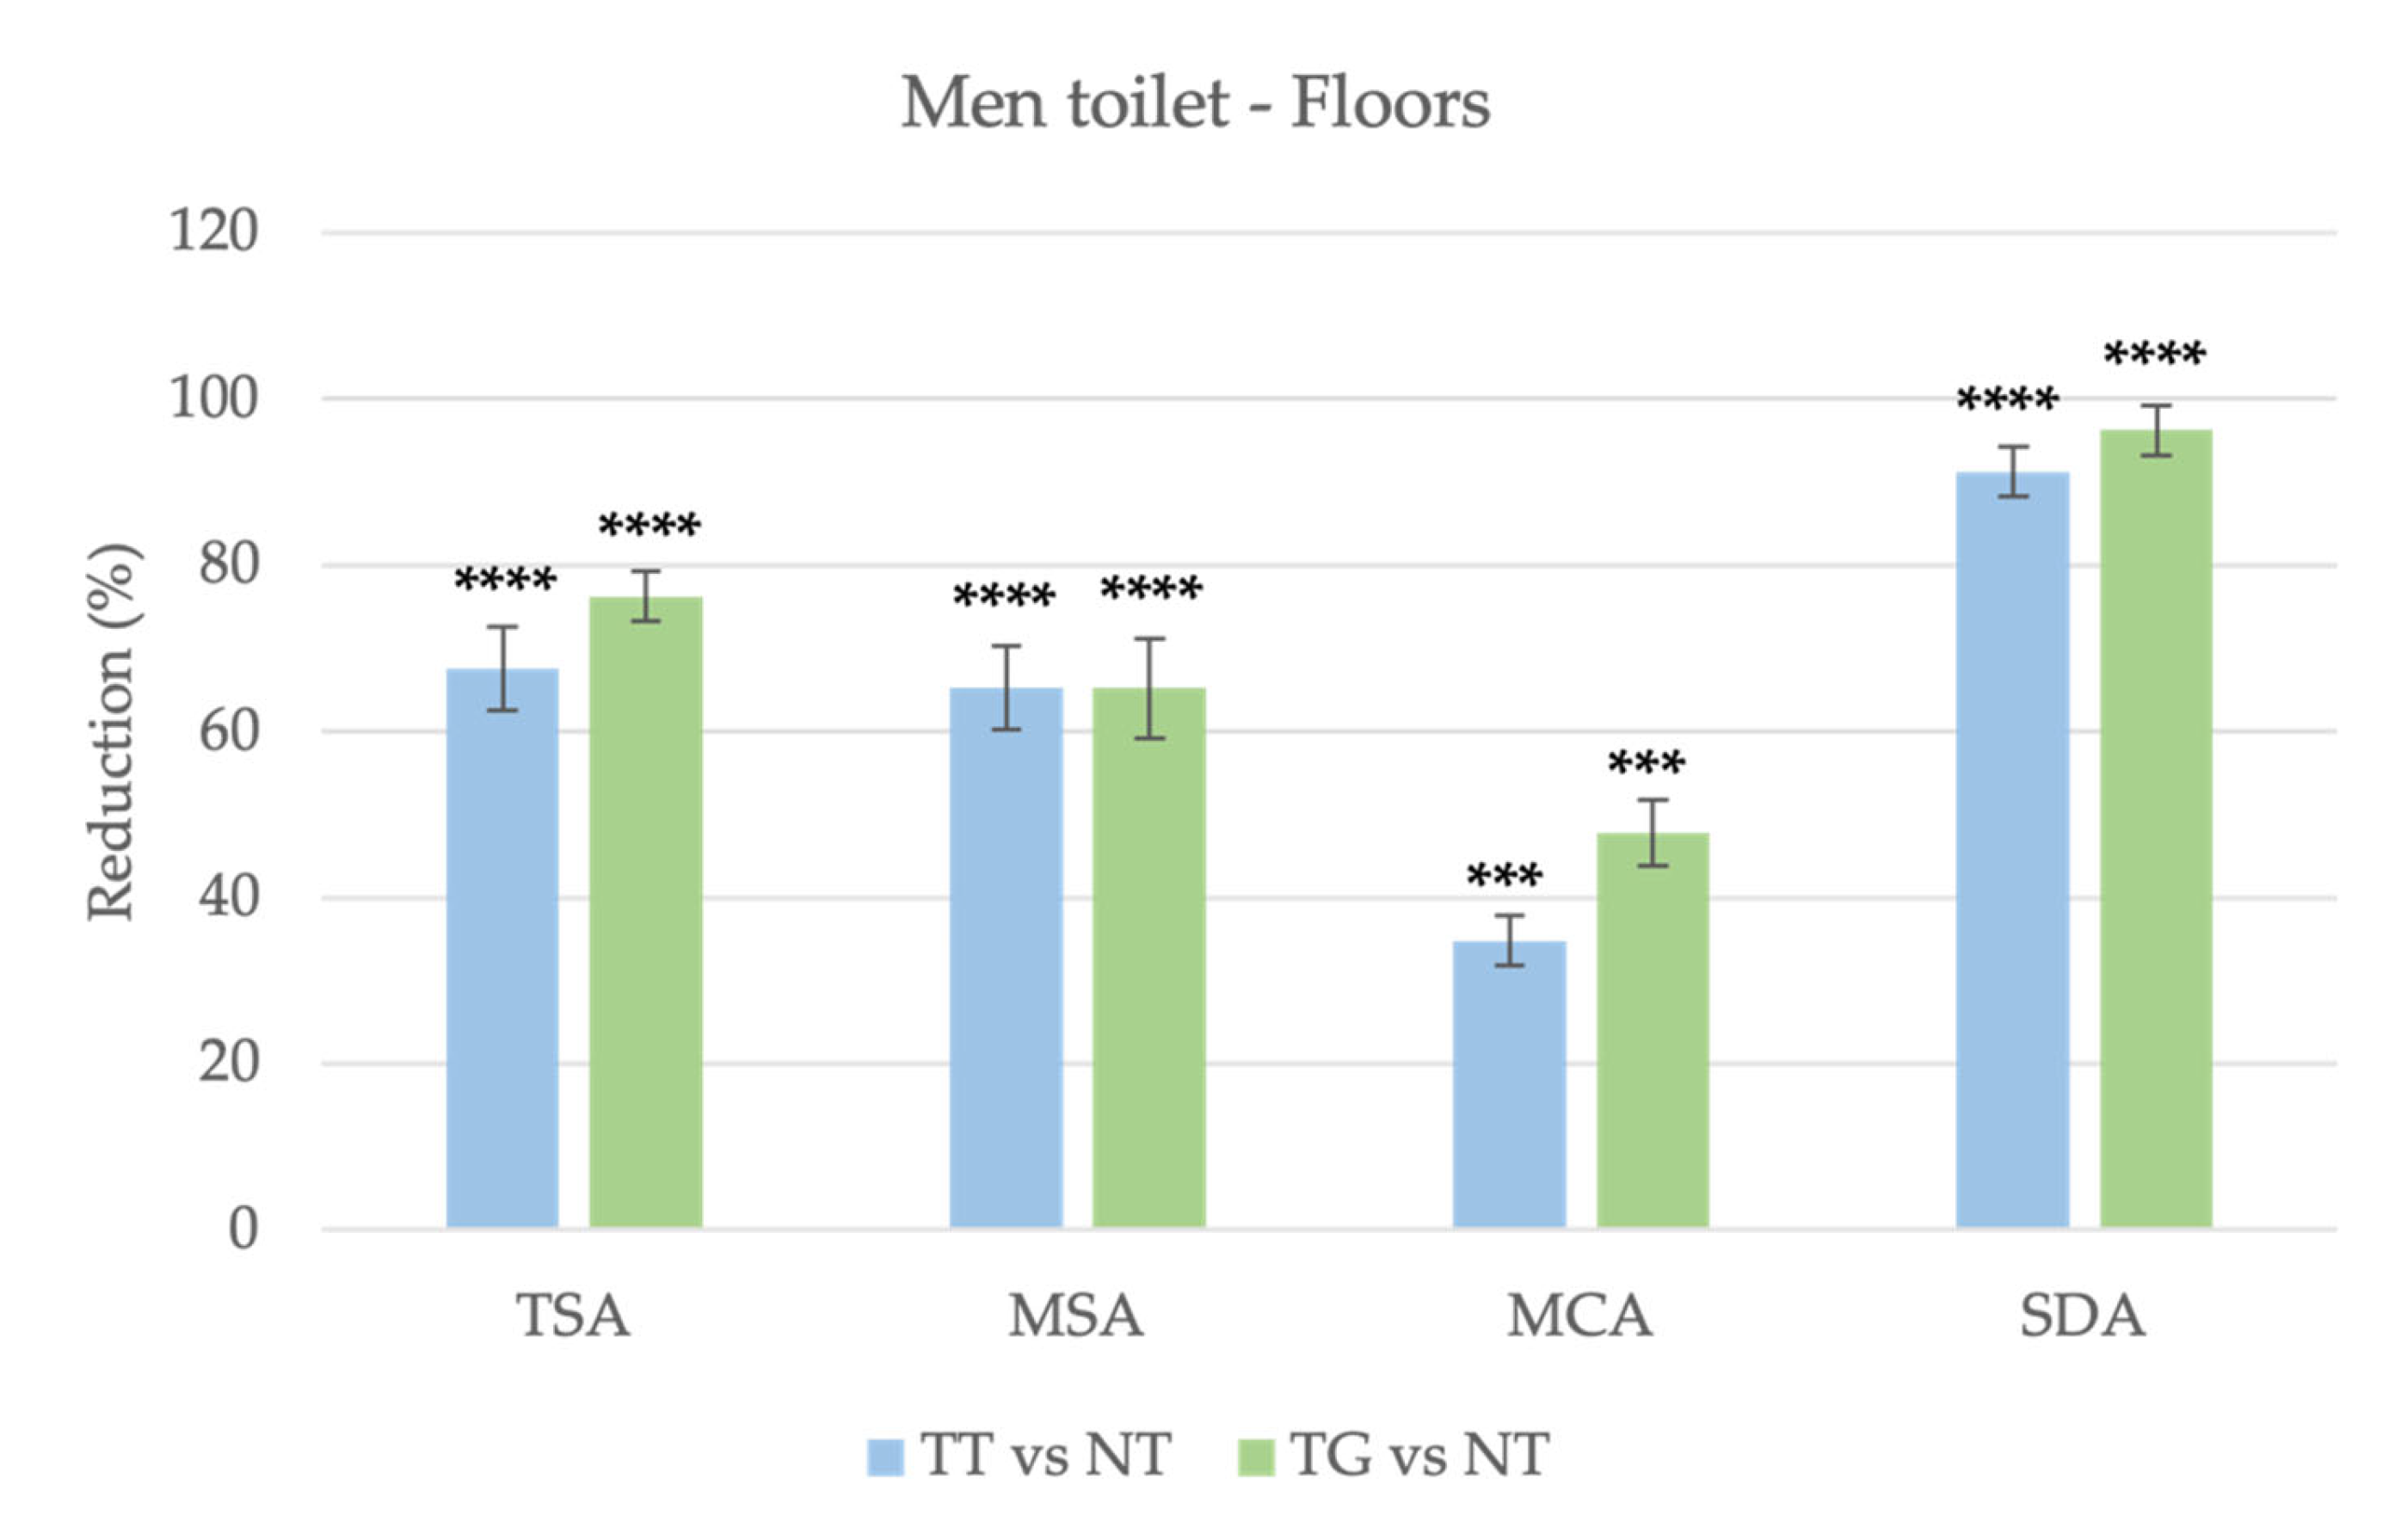
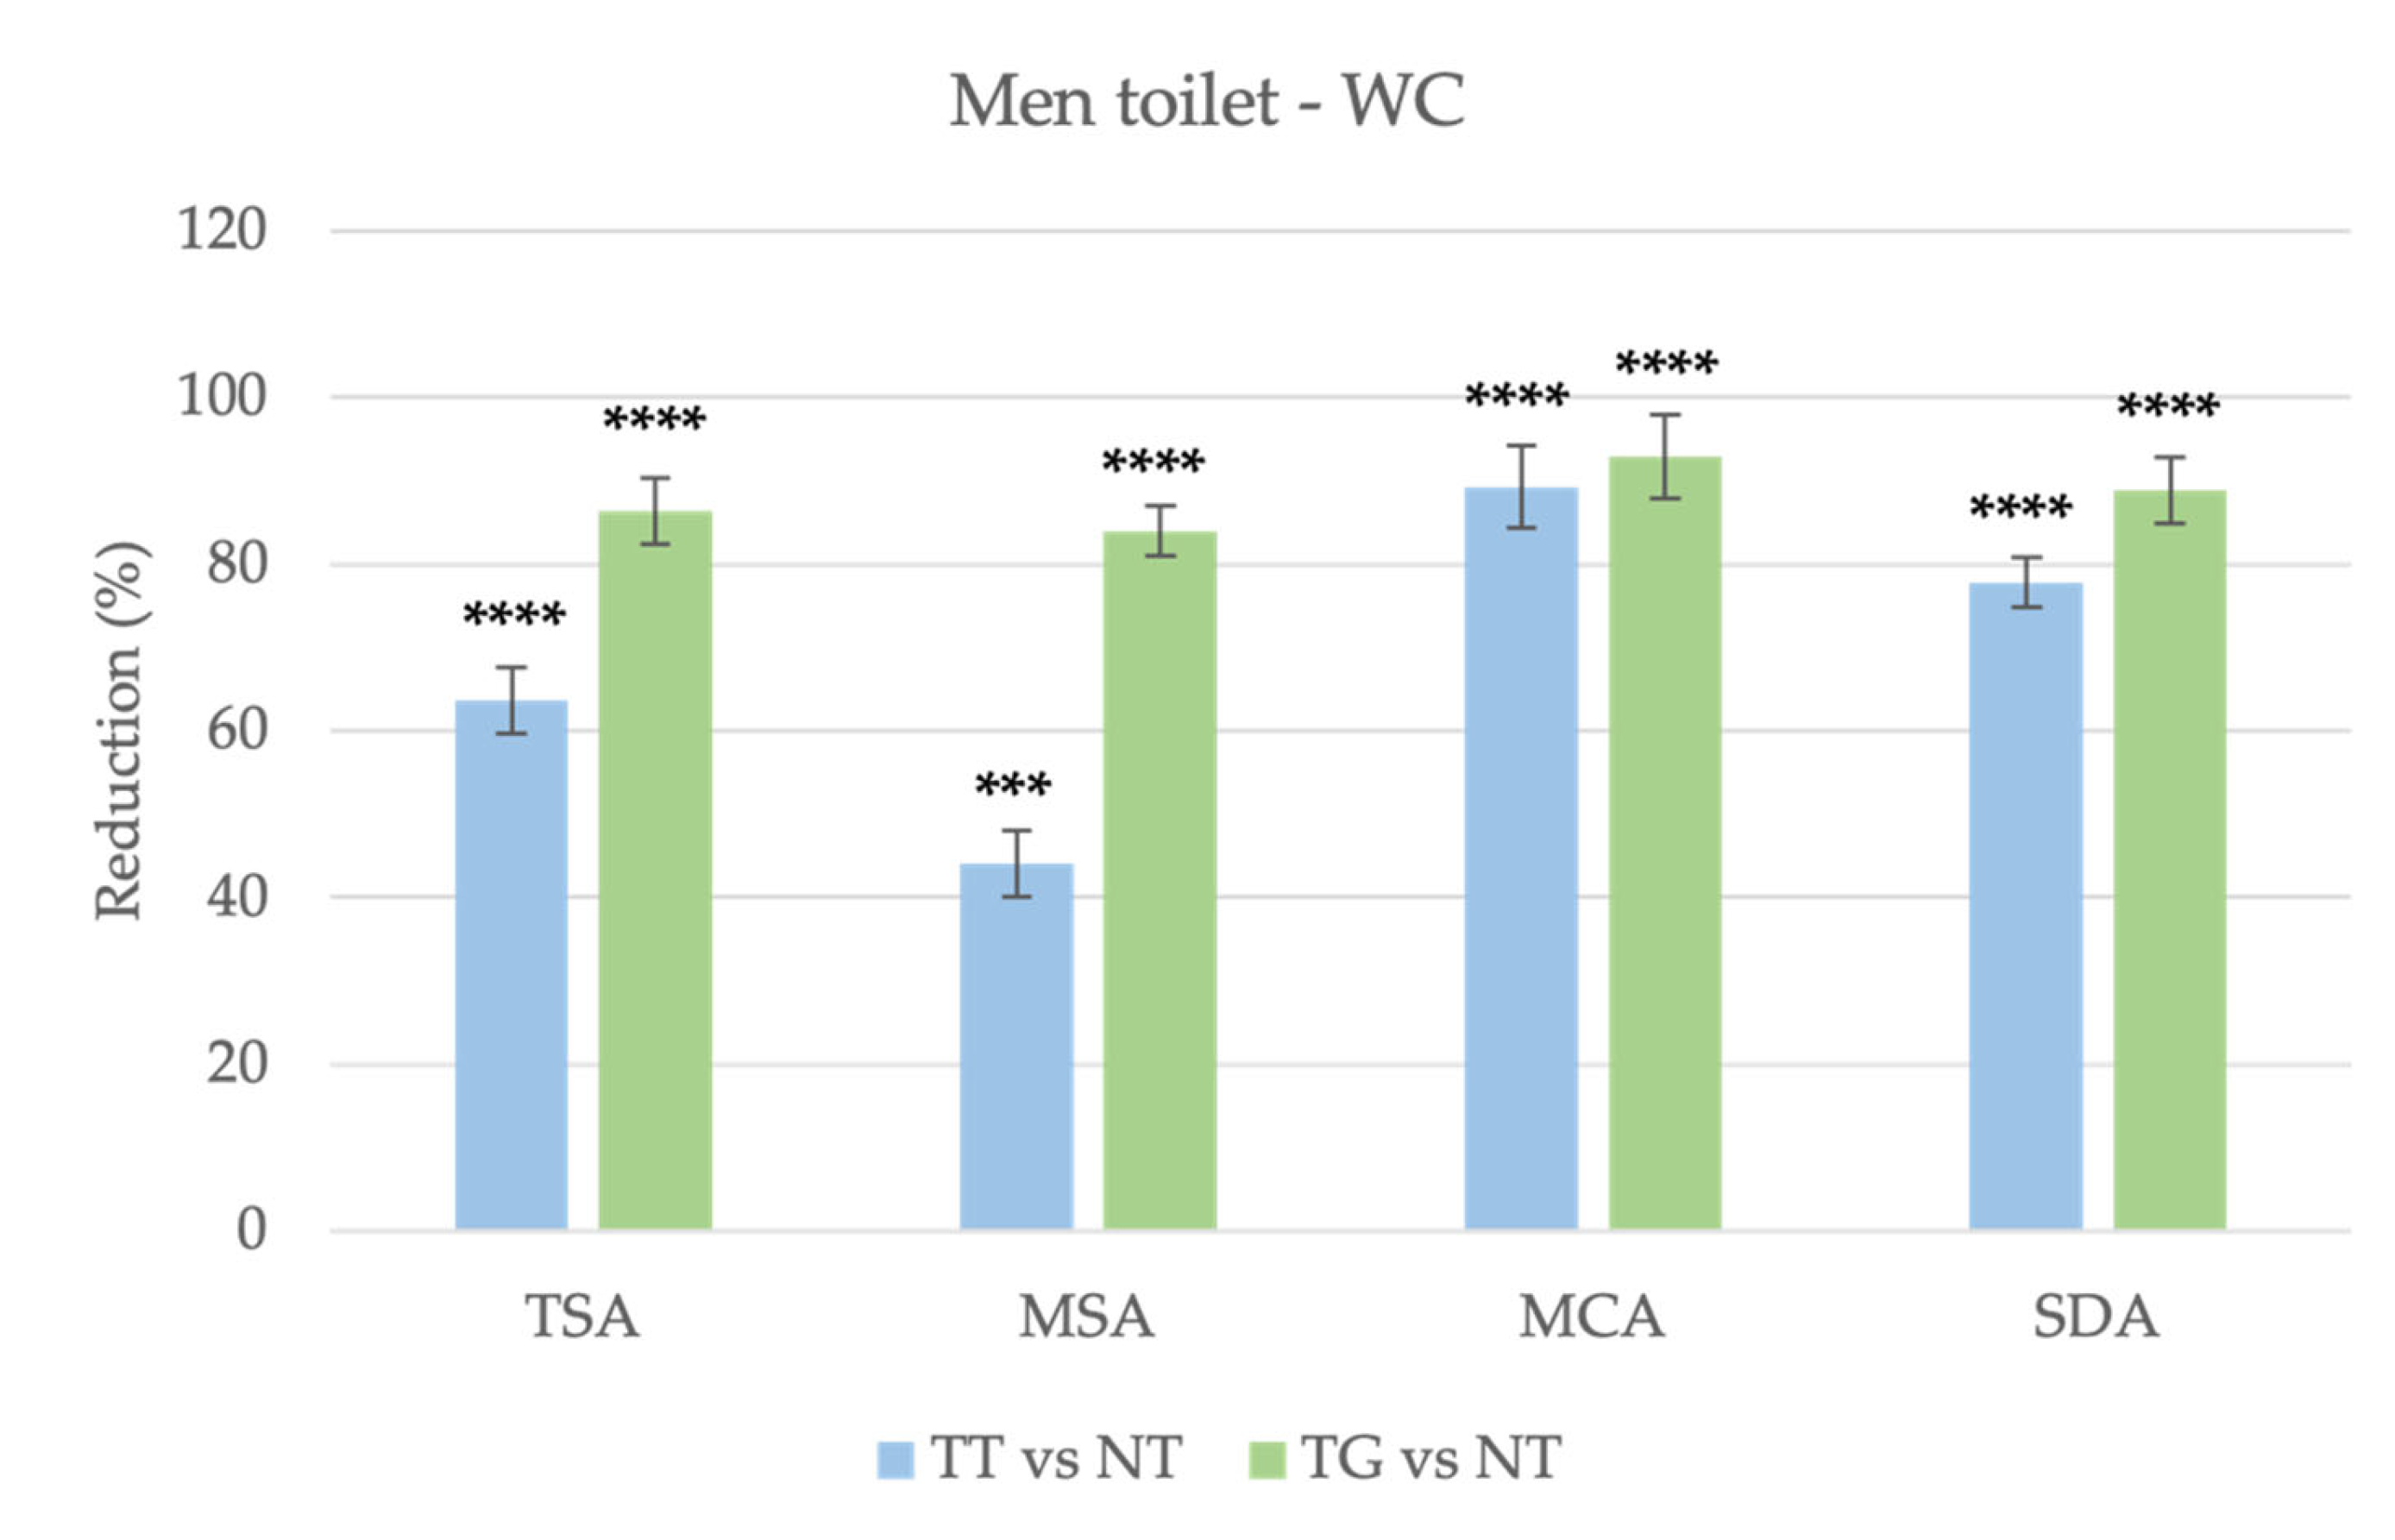
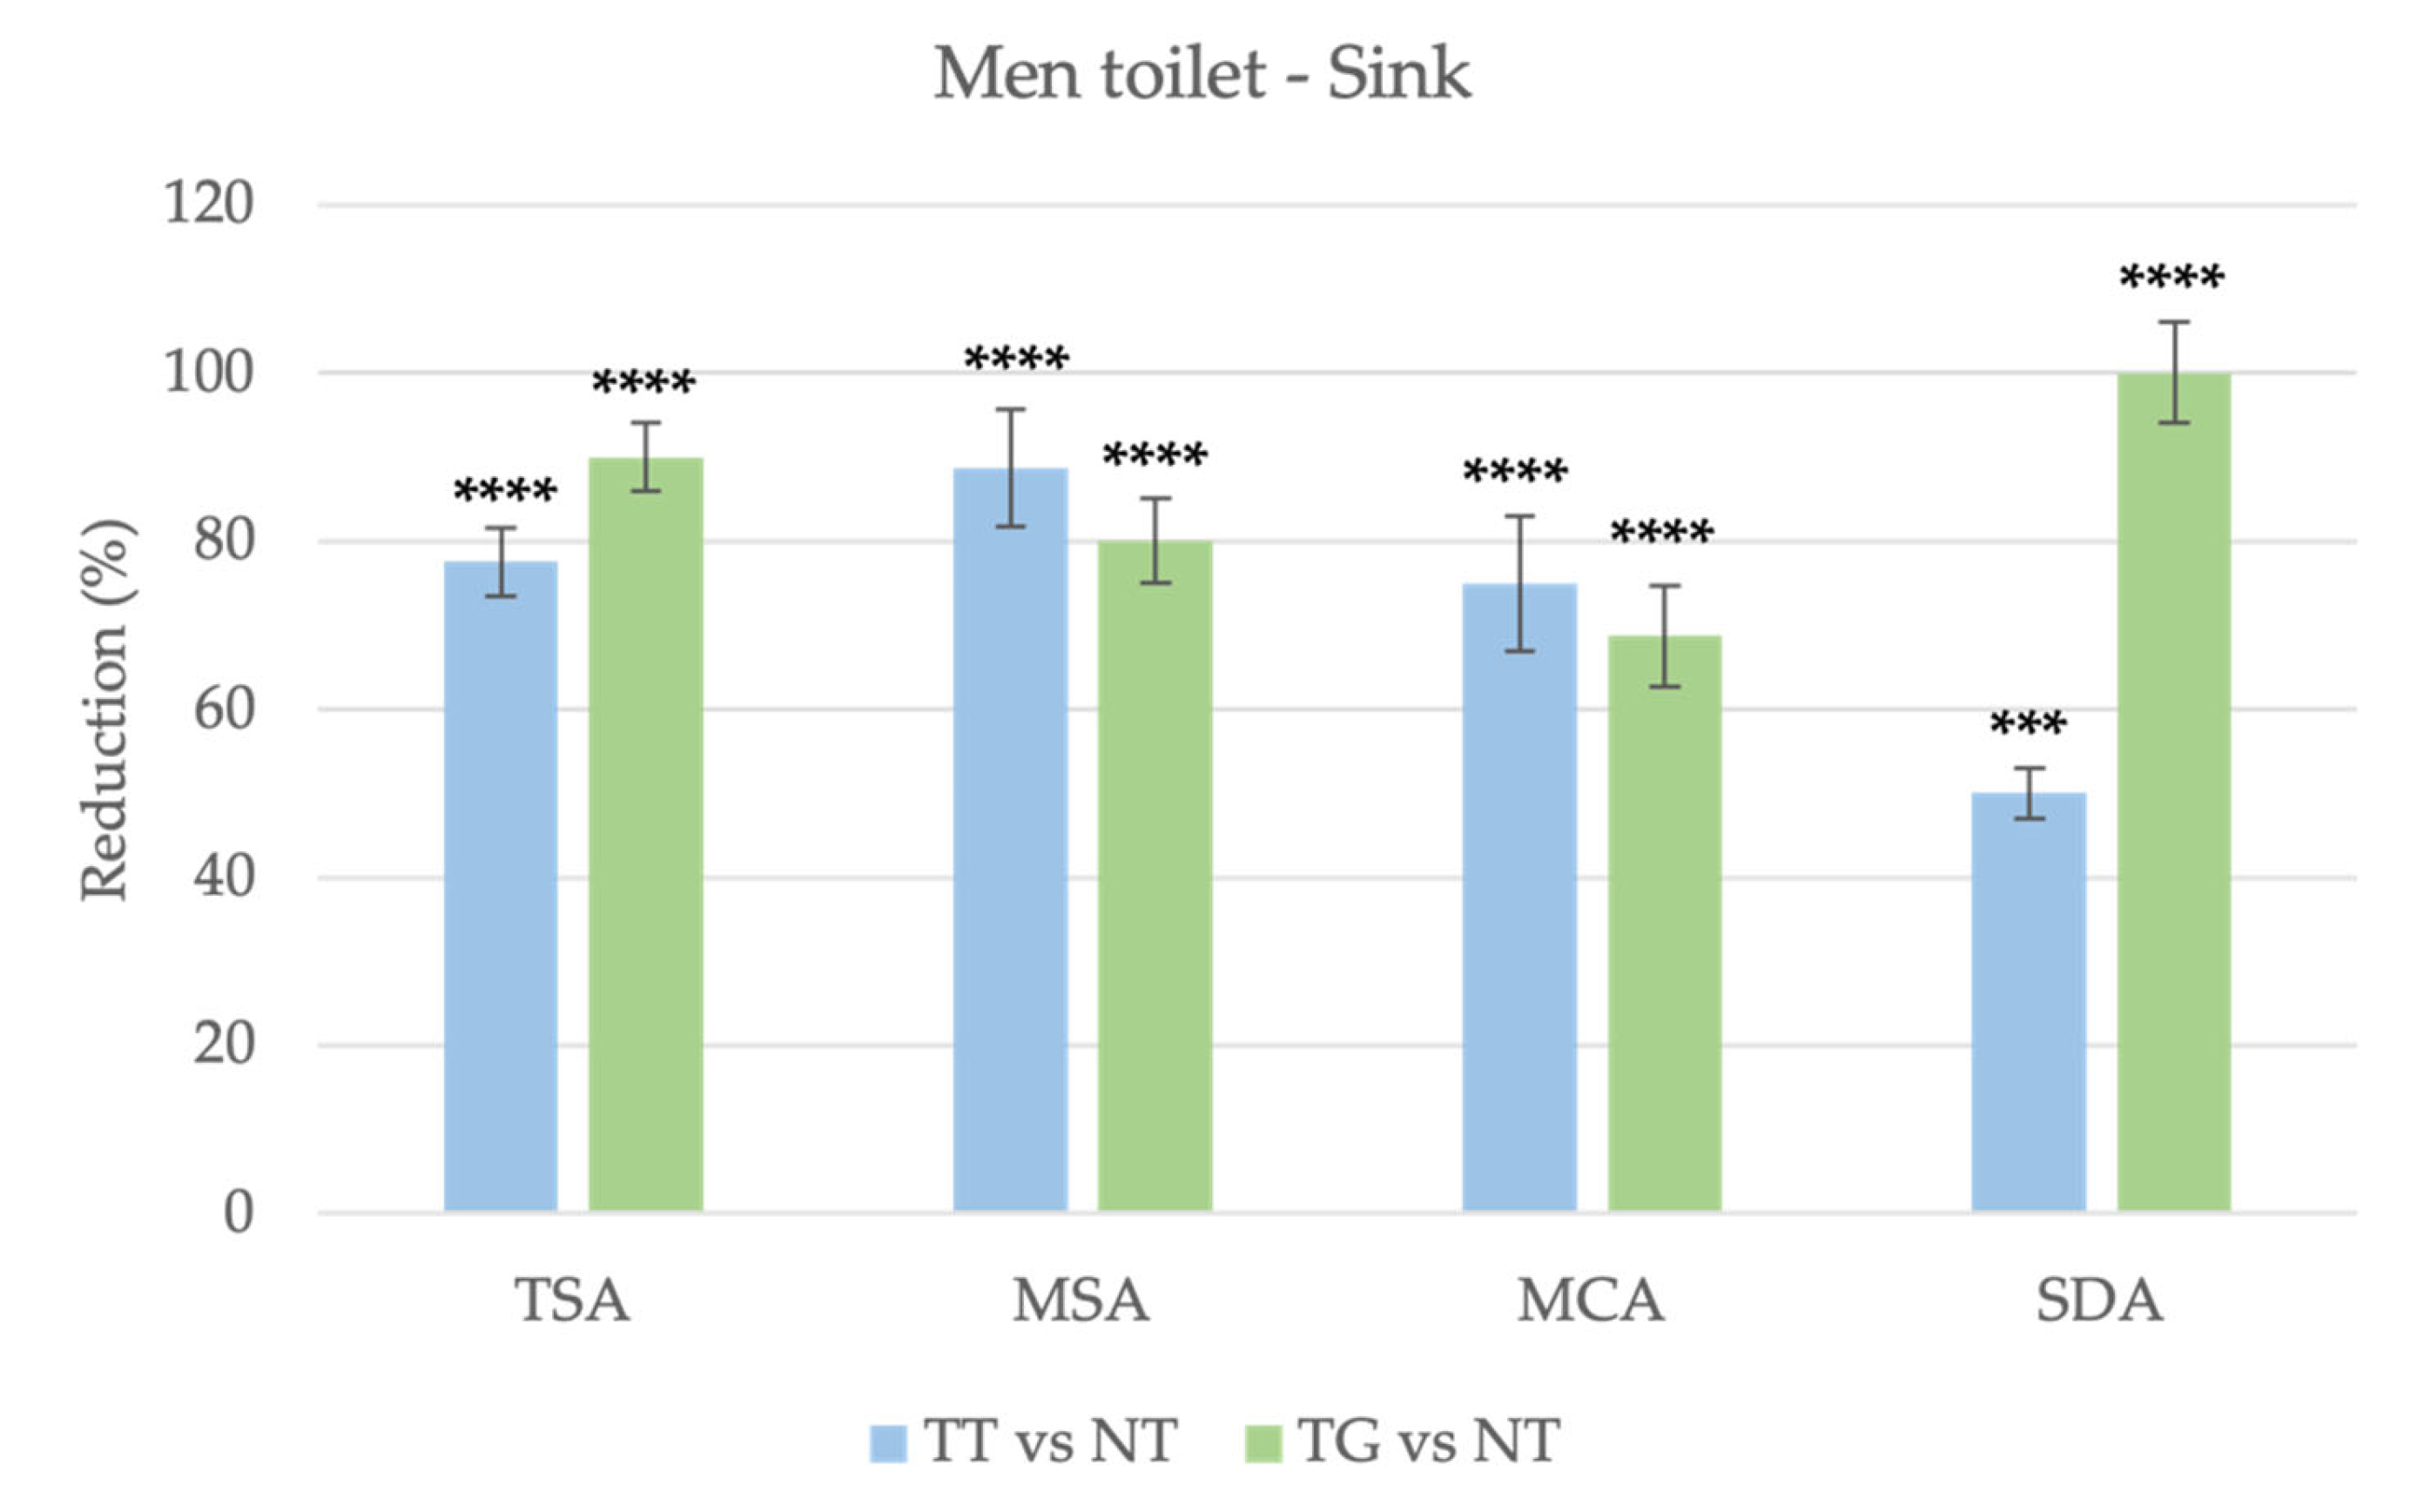
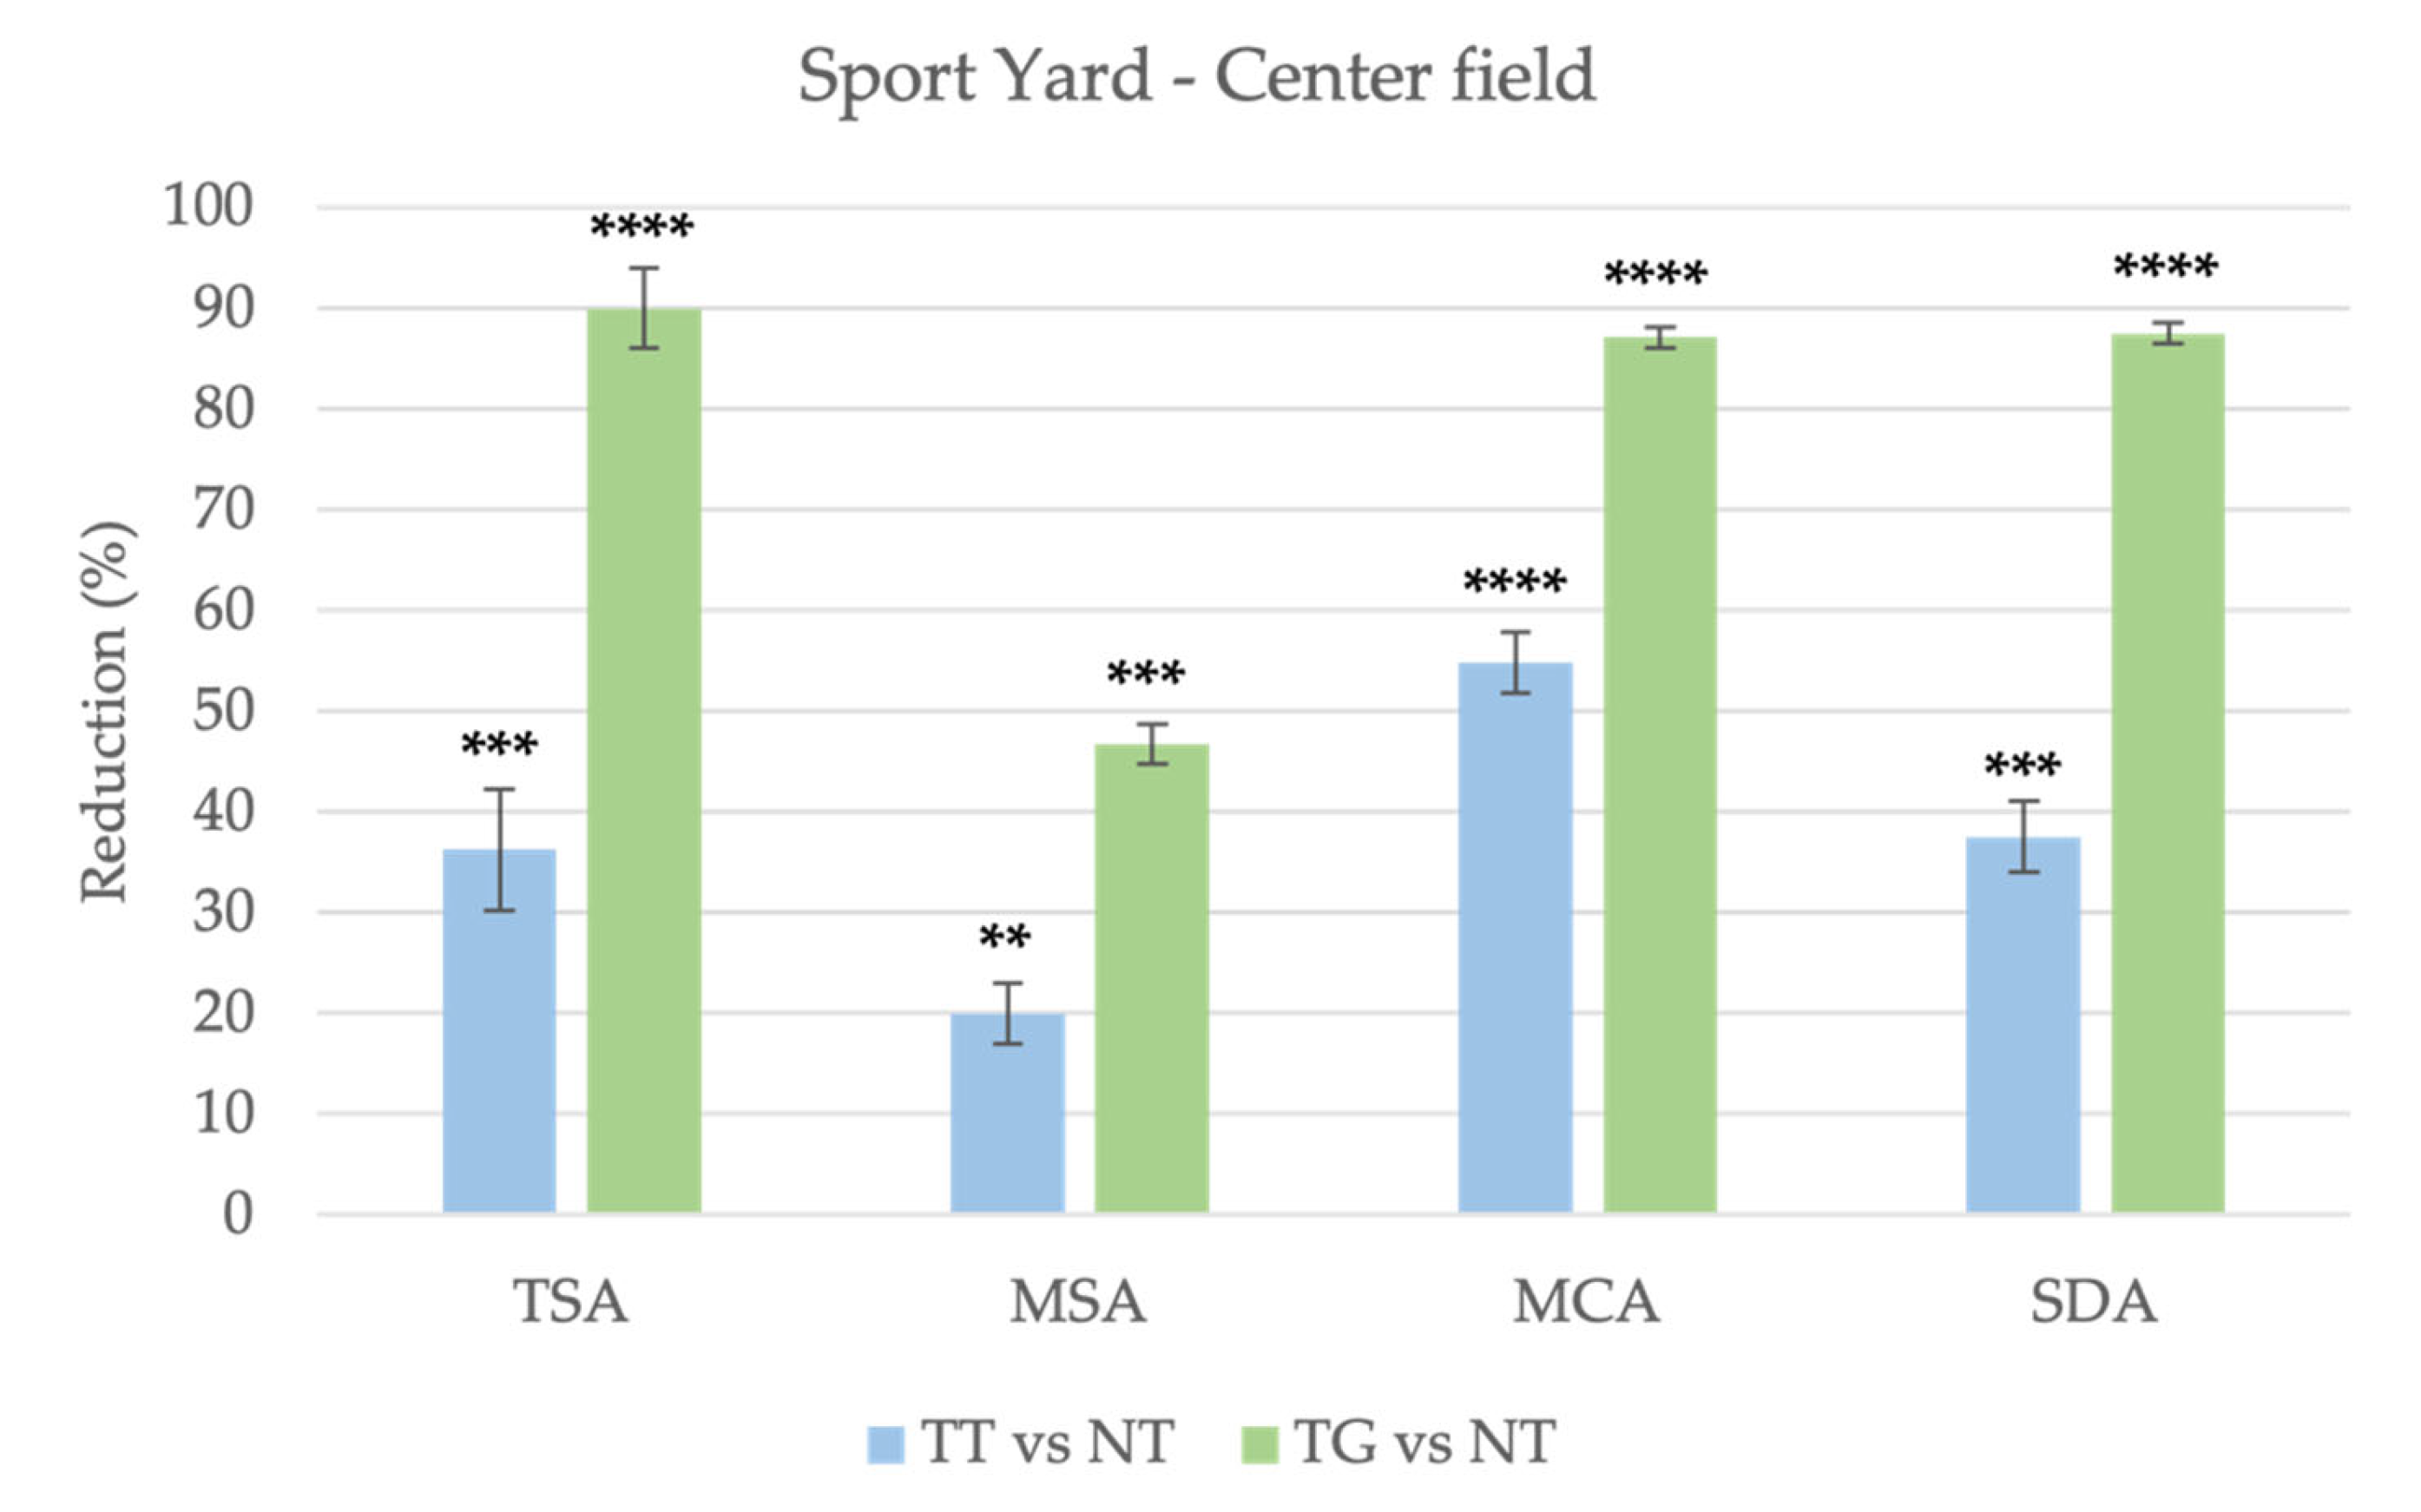
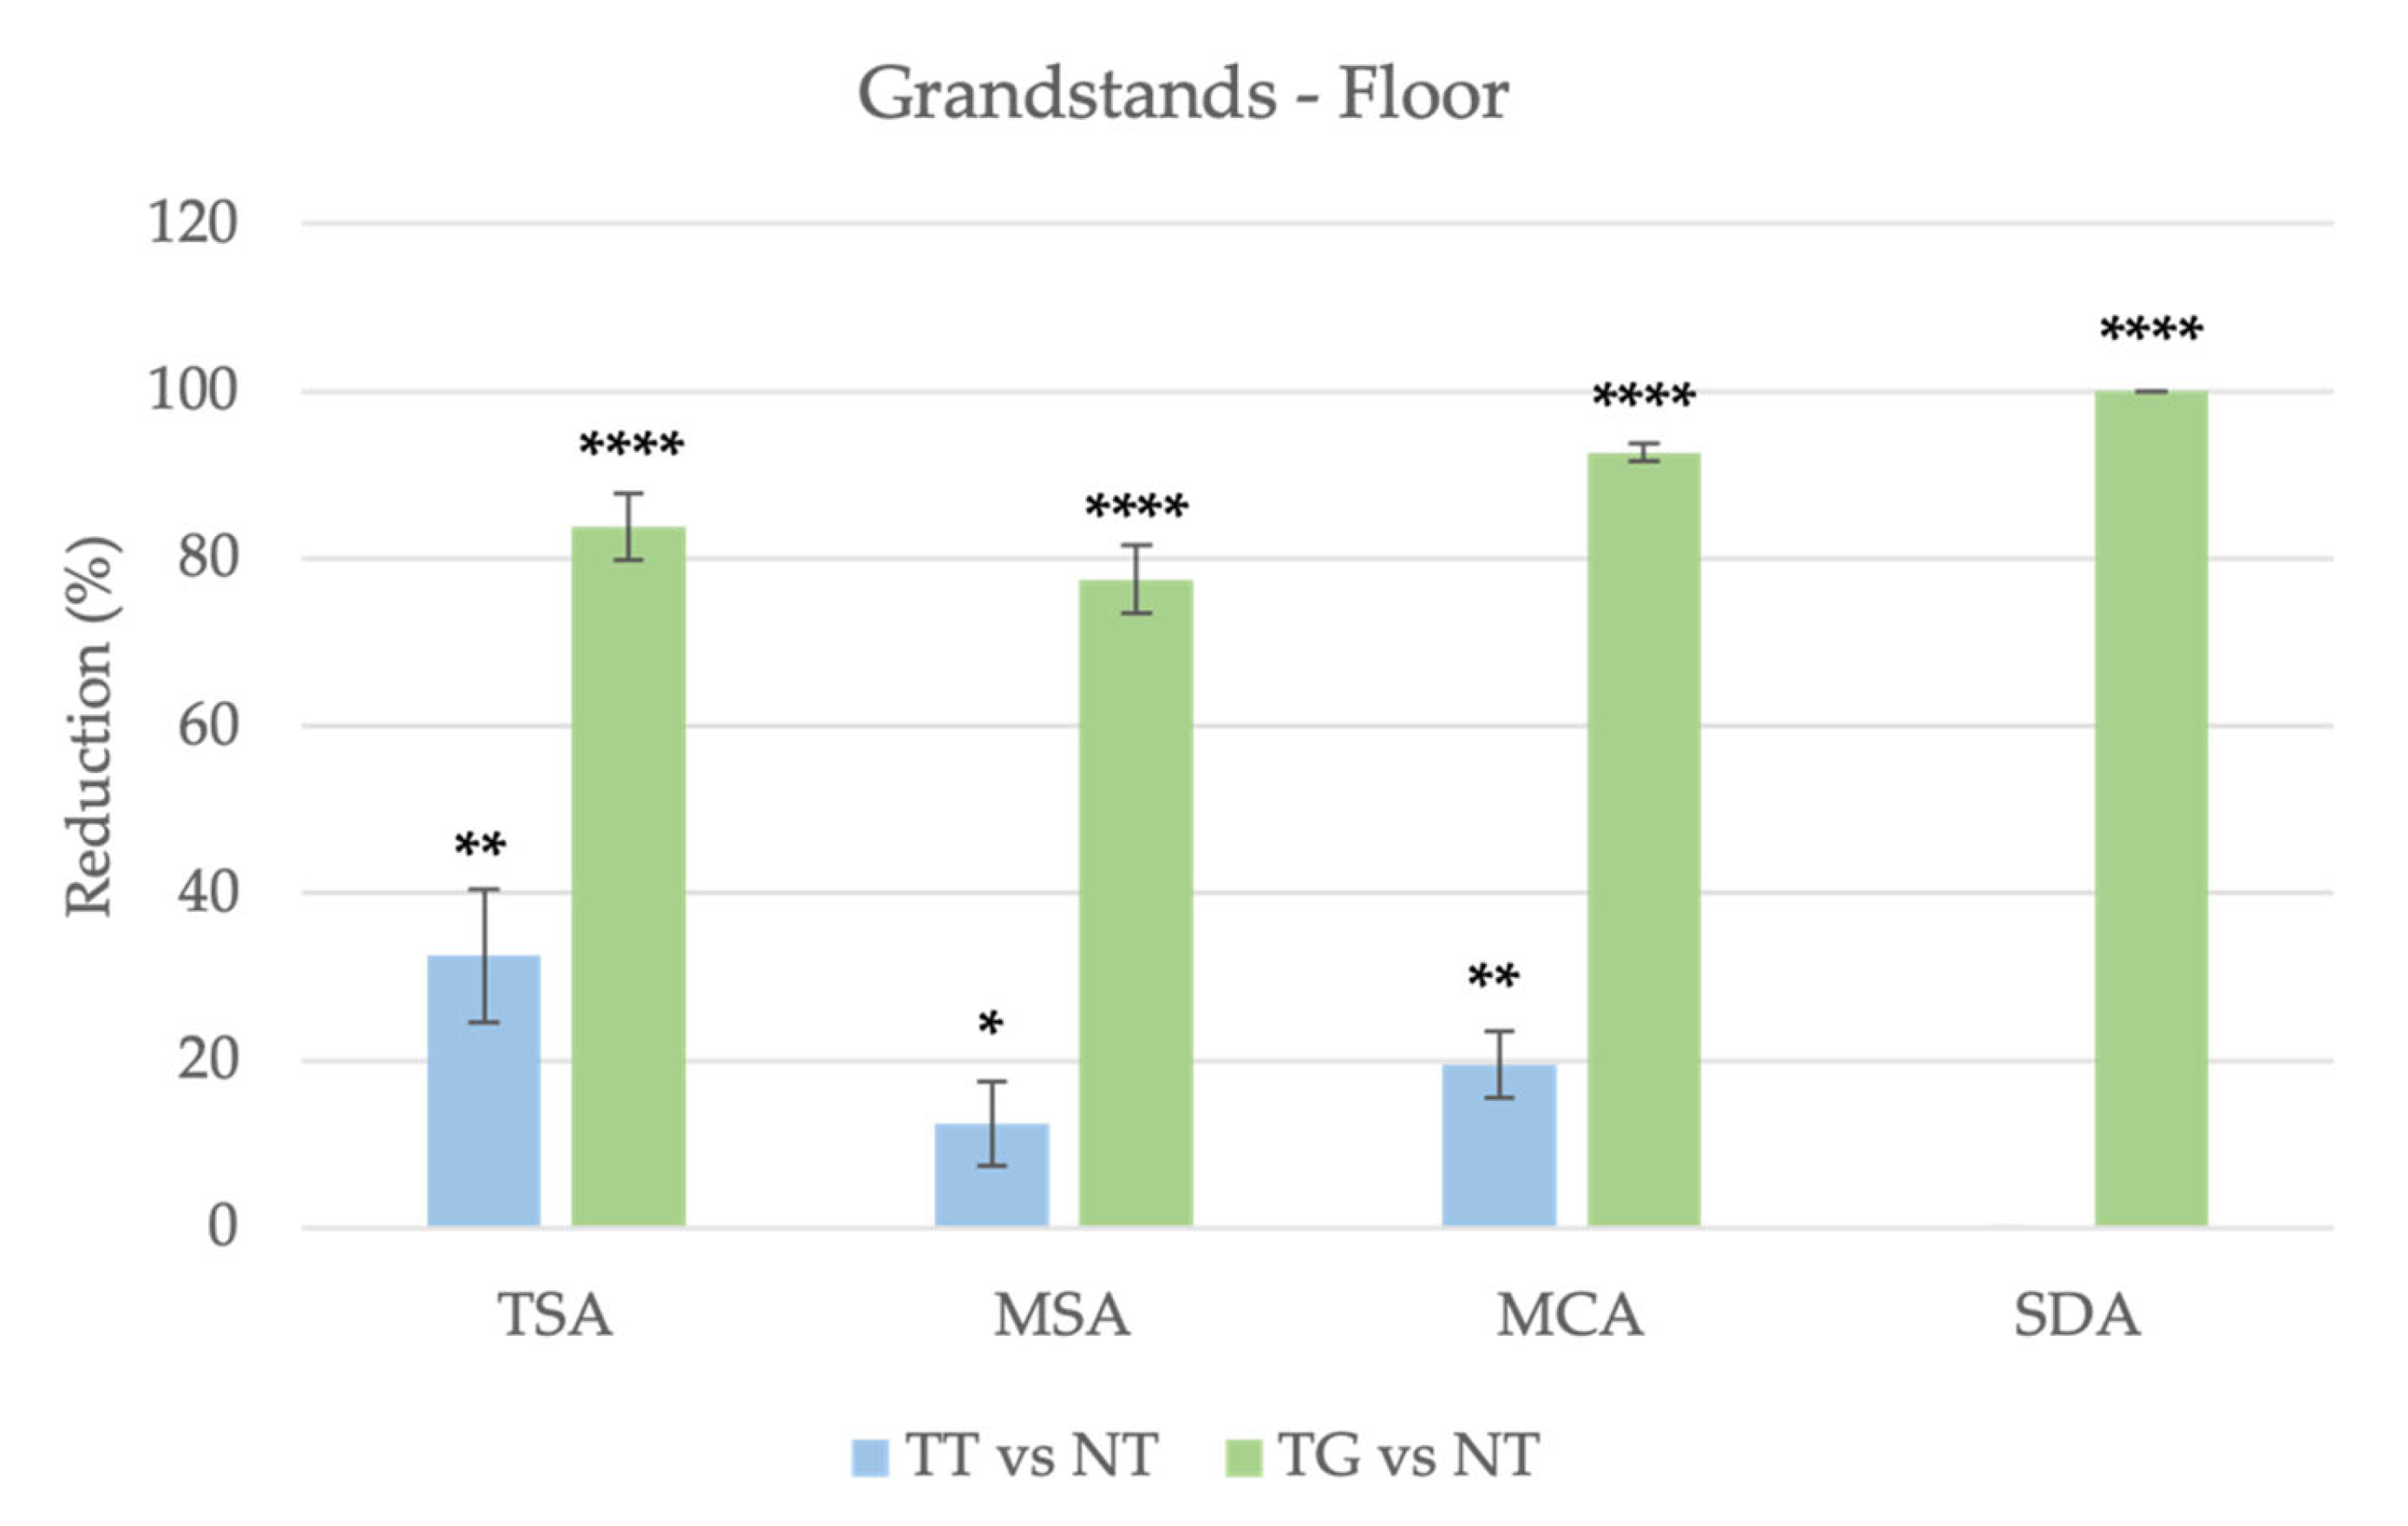
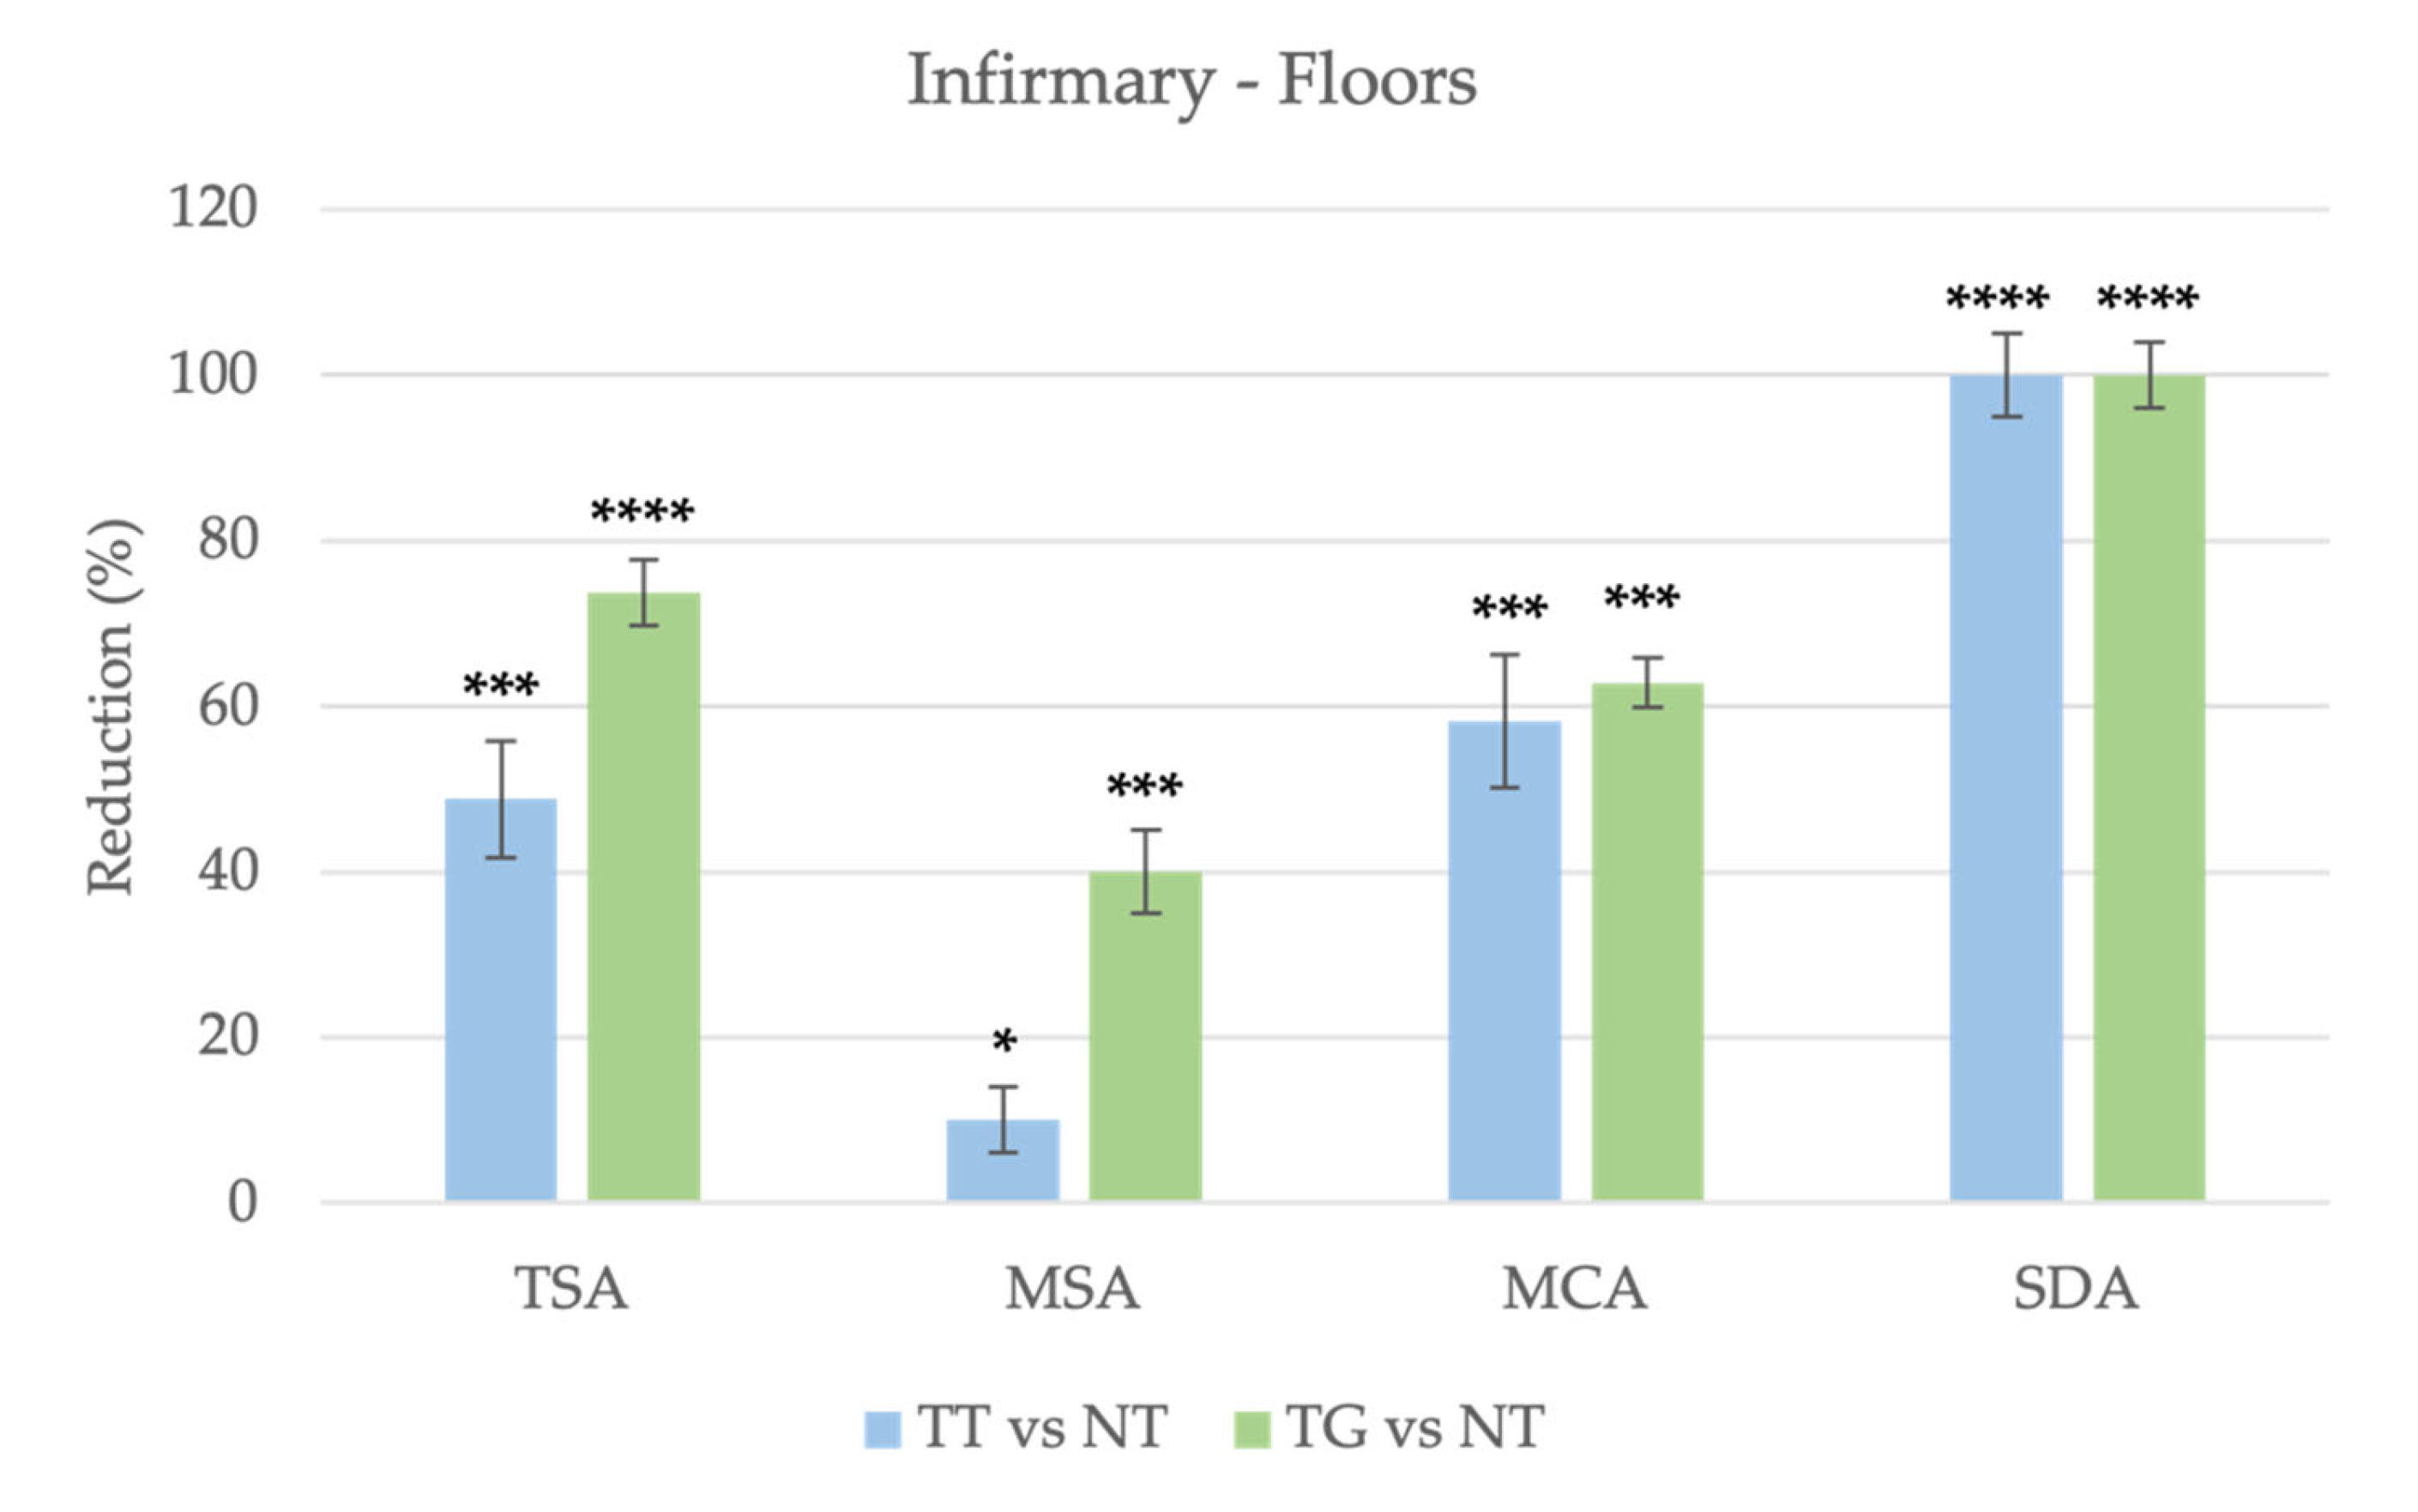
3.1. Cleaning Effectiveness
3.2. Microbial Isolation and Identification
3.3. LCA Analysis
- for the Green Protocol: cleaning chemicals (36.6%), energy consumption (28.5%) and laundry chemicals (17.3%);
- for the Traditional Protocol: textile equipment (46.2%), cleaning chemicals (24.8%) and energy consumption (12.6%).
4. Conclusions
Author Contributions
Funding
Institutional Review Board Statement
Informed Consent Statement
Data Availability Statement
Acknowledgments
Conflicts of Interest
Correction Statement
Abbreviations
| ACC | Aerobic Colony Count |
| API | Analytical Profile Index |
| CAM | Minimal Environmental Criteria |
| CDBA | Clostridium difficile Agar Base |
| CFU | Colony Forming Unit |
| ClDA | Clostridium difficile Agar |
| GHG | Greenhouse Gases |
| GWP | Global Warming Potential |
| INAIL | Istituto Nazionale Assicurazione Infortuni sul Lavoro |
| IPCC | Intergovernmental Panel on Climate Change |
| ISO | International Standard Organization |
| LCA | Life Cycle Assessment |
| MCA | MacConkey Agar |
| MRSA | Methicillin-resistant Staphylococcus aureus |
| MSA | Mannitol Salt Agar |
| NT | Non-treated |
| PCR | Product Category Rules |
| RODAC | Replicate Organism Detection And Counting |
| SDA | Sabouraud Dextrose Agar |
| TG | Green Treatmnet |
| TSA | Tryptic Soy Agar |
| TT | Traditional Treatment |
References
- Mensah, J. Sustainable development: Meaning, history, principles, pillars, and implications for human action: Literature review Justice Mensah|Sustainable development: Meaning, history, principles, pillars, and implications for human action: Literature review public interest statement. Cogent Soc. Sci. 2018, 26, 1653531. [Google Scholar] [CrossRef]
- Mahmud, R.; Moni, S.M.; High, K.; Carbajales-Dale, M. Integration of techno-economic analysis and life cycle assessment for sustainable process design—A review. J. Clean. Prod. 2021, 317, 128247. [Google Scholar] [CrossRef]
- Helling, R.K. The Role of LCA in Sustainable Development. In Encyclopedia of Sustainable Technologies; Abraham, M.A., Ed.; Elsevier: Oxford, UK, 2017; pp. 237–242. [Google Scholar] [CrossRef]
- 302 Final Communication from the Commission to the Council and the European Parliament Integrated Product Policy Building on Environmental Life-Cycle Thinking. Available online: http://europa.eu.int/comm/environment/ipp/ippsum.pdf (accessed on 10 August 2022).
- Sołoducho-Pelc, L.; Sulich, A. Natural Environment Protection Strategies and Green Management Style: Literature Review. Sustainability 2022, 14, 10595. [Google Scholar] [CrossRef]
- Todorov, V.; Dimov, I. Innovative Digital Stochastic Methods for Multidimensional Sensitivity Analysis in Air Pollution Modelling. Mathematics 2022, 10, 2146. [Google Scholar] [CrossRef]
- Friedrich, A.W. Control of hospital acquired infections and antimicrobial resistance in Europe: The way to go. Wien. Med. Wochenschr. 2019, 169, 25–30. [Google Scholar] [CrossRef] [PubMed]
- Kraemer, S.A.; Ramachandran, A.; Perron, G.G. Antibiotic Pollution in the Environment: From Microbial Ecology to Public Policy. Microorganisms 2019, 7, 180. [Google Scholar] [CrossRef] [PubMed]
- Kate, H.; Keith, B.; Matt, M.; Craig, G. Comparing the Current Chemical Cleaning Regime and Chemical-Free Cleaning at the University of Canterbury: A Report and Practical Microbiological Experiment for the Sustainability Office, University of Canterbury. 2011. Available online: https://www.canterbury.ac.nz/media/documents/sustain/Comparing_Chemical_and_Non_Chemical_Cleaning.pdf (accessed on 10 August 2022).
- Boyce, J.M. Modern technologies for improving cleaning and disinfection of environmental surfaces in hospitals. Antimicrob. Resist. Infect. Control 2016, 5, 10. [Google Scholar] [CrossRef] [PubMed]
- Exner, M.; Bhattacharya, S.; Gebel, J.; Goroncy-Bermes, P.; Hartemann, P.; Heeg, P.; Ilschner, C.; Kramer, A.; Ling, M.L.; Merkens, W.; et al. Chemical disinfection in healthcare settings: Critical aspects for the development of global strategies. GMS Hyg. Infect. Control 2020, 15, 36. [Google Scholar] [CrossRef]
- La Contaminazione Microbiologica Delle Superfici Negli Ambienti Lavorativi. 2017. Available online: www.inail.it (accessed on 10 August 2022).
- Linee Guida Sugli Standard di Sicurezza e di Igiene del Lavoro nel Reparto Operatorio Istituto Superiore per la Prevenzione e la Sicurezza del Lavoro Dipartimento Igiene del Lavoro. Available online: http://www.ispesl.it (accessed on 10 August 2022).
- Dancer, S. How do we assess hospital cleaning? A proposal for microbiological standards for surface hygiene in hospitals. J. Hosp. Infect. 2004, 56, 10–15. [Google Scholar] [CrossRef] [PubMed]
- Galvin, S.; Dolan, A.; Cahill, O.; Daniels, S.; Humphreys, H. Microbial monitoring of the hospital environment: Why and how? J. Hosp. Infect. 2012, 82, 143–151. [Google Scholar] [CrossRef]
- Flouchi, R.; Elmniai, A.; El Far, M.; Touzani, I.; El Hachlafi, N.; Fikri-Benbrahim, K. Microbiological Monitoring of the Environment Using the “Association Rules” Approach and Disinfection Procedure Evaluation in a Hospital Center in Morocco. J. Environ. Public Health 2021, 2021, 19. [Google Scholar] [CrossRef] [PubMed]
- Griffith, C.; Obee, P.; Cooper, R.; Burton, N.; Lewis, M. The effectiveness of existing and modified cleaning regimens in a Welsh hospital. J. Hosp. Infect. 2007, 66, 352–359. [Google Scholar] [CrossRef] [PubMed]
- Griffith, C.; Cooper, R.; Gilmore, J.; Davies, C.; Lewis, M. An evaluation of hospital cleaning regimes and standards. J. Hosp. Infect. 2000, 45, 19–28. [Google Scholar] [CrossRef] [PubMed]
- ISO 23231:2008; Textiles—Determination of Dimensional Change of Fabrics—Accelerated Machine Method. ISO: Geneva, Switzerland, 2008. Available online: https://www.iso.org/standard/41398.html (accessed on 15 December 2022).
- Nilsen, S.K.; Dahl, I.; Jhrgensen, O.; Schneider, T. Micro-ÿbre and Ultra-Micro-ÿbre Cloths, Their Physical Characteristics, Cleaning Eeect, Abrasion on Surfaces, Friction, and Wear Resistance. 2002. Available online: www.elsevier.com/locate/buildenv (accessed on 12 August 2022).
- Smith, D.; Gillanders, S.; Holah, J.; Gush, C. Assessing the efficacy of different microfibre cloths at removing surface micro-organisms associated with healthcare-associated infections. J. Hosp. Infect. 2011, 78, 182–186. [Google Scholar] [CrossRef] [PubMed]
- Hart, P.W.; Manager, S.T.; Operations, M.M.; Rudie, A. Hydrogen peroxide: An environmentally friendly but dangerous bleaching chemical. In Proceedings of the TAPPI Engineering, Pulping and Environmental Conference, Jacksonville, FL, USA, 21–23 October 2007; TAPPI Press: Atlanta, GA, USA, 2007; pp. 1–44. Available online: https://www.fs.usda.gov/research/treesearch/34782 (accessed on 16 December 2022).
- Hydrogen Peroxide 1. General Statement. Available online: https://www.arkema.com/files/live/sites/shared_arkema/files/downloads/socialresponsability/safety-summuries/hydrogen-peroxide-hydrogen-peroxide-gps-2013-07-15-v0.pdf (accessed on 18 December 2022).
- Vanhecke, P.; Sigwarth, V.; Moirandat, C. A Potent and Safe H2O2 Fumigation Approach. PDA J. Pharm. Sci. Technol. 2012, 66, 354–370. [Google Scholar] [CrossRef] [PubMed]
- ISO 14040:2006; Environmental Management—Life Cycle Assessment—Principles and Framework. ISO: Geneva, Switzerland, 2006. Available online: https://www.iso.org/standard/37456.html (accessed on 10 August 2022).
- ISO 14044:2006; Environmental Management—Life Cycle Assessment—Requirements and Guidelines. ISO: Geneva, Switzerland, 2006. Available online: https://www.iso.org/standard/38498.html (accessed on 10 August 2022).
- ISO 14067:2018; Greenhouse Gases—Carbon Footprint of Products—Requirements and Guidelines for Quantification. ISO: Geneva, Switzerland, 2018. Available online: https://www.iso.org/standard/71206.html (accessed on 10 August 2022).
- Product Category Rules Construction Products and Construction Services 2012:01 VERSION 2.2. 2017. Available online: www.environdec.com (accessed on 10 August 2022).
- Voss, A.; Loeffen, F.; Bakker, J.; Klaassen, C.; Wulf, M. Methicillin-resistant Staphylococcus aureus in Pig Farming. Emerg. Infect. Dis. 2005, 11, 1965–1966. [Google Scholar] [CrossRef] [PubMed]
- Garcia-Graells, C.; Van Cleef, B.A.G.L.; Larsen, J.; Denis, O.; Skov, R.; Voss, A. Dynamic of Livestock-Associated Methicillin-Resistant Staphylococcus aureus CC398 in Pig Farm Households: A Pilot Study. PLoS ONE 2013, 8, e65512. [Google Scholar] [CrossRef] [PubMed]
- Reynolds, K.A.; Watt, P.M.; Boone, S.A.; Gerba, C.P. Occurrence of bacteria and biochemical markers on public surfaces. Int. J. Environ. Health Res. 2005, 15, 225–234. [Google Scholar] [CrossRef] [PubMed]
- Elsergany, M.; Moussa, M.; Ahsan, A.; Khalfan, A.; Eissa, A. Exploratory Study of Bacterial Contamination of Different Surfaces in Four Shopping Malls in Sharjah, UAE. J. Environ. Occup. Sci. 2015, 4, 101–105. [Google Scholar] [CrossRef]
- Andersen, J.B.; Elborne, S.A. Moulds and Indoor Climate in Denmark. In International Research Group on Wood Protection—Conference Proceedings. 2005. Available online: https://www.irg-wp.com/irgdocs/details.php?fb903ff8-cb8e-4e82-996b-b4c8baec28f7 (accessed on 22 September 2022).
- Adams, R.I.; Miletto, M.; Taylor, J.W.; Bruns, T.D. The Diversity and Distribution of Fungi on Residential Surfaces. PLoS ONE 2013, 8, e78866. [Google Scholar] [CrossRef] [PubMed]


| Cleaning Operation | Environment | Frequency |
|---|---|---|
| Wet dusting with detergent | Furniture in all indoor areas | Daily (7/7) |
| Wet dusting with detergent | Area 3—Toilets/changing rooms | Daily (7/7) |
| Periodic descaling toilets and sanitary | Sanitary in all internal areas | Bi-monthly (2/30) |
| Wet dusting of electronic equipment with suitable detergent | Cleaning of electronic, mechanical and computer equipment in Area 1—Offices and Area 4—Technical areas | Daily (7/7) |
| Disinfection of changing rooms | Inside and outside lockers in changing rooms in Area 3—Changing rooms | Daily (7/7) |
| Disinfection furniture accessories of bathrooms and showers | Area 3—Toilets | Daily (7/7) |
| Manual floor washing | All indoor areas (central arena excluded) | Bi-weekly (2/7) |
| Manual floor washing with detergent-disinfectant | Changing rooms | Bi-weekly (2/7) |
| Mechanized floor washing (with scrubbing machine) | Corridors in all internal areas | Bi-weekly (2/7) |
| Dry sweeping and punctual stain removal | Central Arena in Area 9—Sport spaces/stands/pools | Bi-weekly (2/7) |
| Washing of entrance doors and windows | Area 2—Connective spaces | Monthly (1/30) |
| Isolated Microorganisms | ||
|---|---|---|
| Staphylococcus cohnii | Enterobacter spp. | Buttiauxella agrestis |
| Staph. hominis | Enterococcus faecium | Candida albicans |
| Staph. gallinarum | Enterococcus gallinarum | Candida boidinii |
| Staph. epidermidis | Enterococcus hirae | Candida catenulata |
| Staph. auricularis | Escherichia coli | Candida ciferrii |
| Staph. xylosus | Pectobacterium carotovorum | Trichosporon spp. |
| Staph. sciuri | Providencia rustigianii | Saccharomyces cerevisiae |
| Staph. capitis | Raoultella spp. |
Disclaimer/Publisher’s Note: The statements, opinions and data contained in all publications are solely those of the individual author(s) and contributor(s) and not of MDPI and/or the editor(s). MDPI and/or the editor(s) disclaim responsibility for any injury to people or property resulting from any ideas, methods, instructions or products referred to in the content. |
© 2022 by the authors. Licensee MDPI, Basel, Switzerland. This article is an open access article distributed under the terms and conditions of the Creative Commons Attribution (CC BY) license (https://creativecommons.org/licenses/by/4.0/).
Share and Cite
Fontana, R.; Marzola, M.; Buratto, M.; Trioschi, G.; Caproni, A.; Nordi, C.; Buffone, C.; Bandera, B.; Vogli, L.; Marconi, P. Analysis of Civil Environments Cleaning Services—Microbiological and LCA Analysis after Traditional and Sustainable Procedures. Sustainability 2023, 15, 696. https://doi.org/10.3390/su15010696
Fontana R, Marzola M, Buratto M, Trioschi G, Caproni A, Nordi C, Buffone C, Bandera B, Vogli L, Marconi P. Analysis of Civil Environments Cleaning Services—Microbiological and LCA Analysis after Traditional and Sustainable Procedures. Sustainability. 2023; 15(1):696. https://doi.org/10.3390/su15010696
Chicago/Turabian StyleFontana, Riccardo, Marco Marzola, Mattia Buratto, Giulia Trioschi, Anna Caproni, Chiara Nordi, Cesare Buffone, Beatrice Bandera, Luciano Vogli, and Peggy Marconi. 2023. "Analysis of Civil Environments Cleaning Services—Microbiological and LCA Analysis after Traditional and Sustainable Procedures" Sustainability 15, no. 1: 696. https://doi.org/10.3390/su15010696